Blogs
Malika Menoud – Let’s play with the isotopic signatures!
What I am doing in my PhD is to measure the isotopic signatures from different methane sources and at several locations. I’ve now started more than 2 years ago and start to have a decently large dataset of characterized sources. Let’s team-up with the people who are modelling the CH4 isotopes and see how we can make good use of each other’s work!
Lucky with the weather conditions: view on the Eiffel Tower!
I’ve spent almost 4 weeks at LSCE (Laboratoire des Sciences du Climat et de l’Environnement), hosted by Barbara Szenasi. She’s one of the MEMO2 PhD students based at LSCE, along with Sara Defratyka. I sat in Barbara’s office, next to the window with a view on the Eiffel Tower! Ok, it is only visible on sunny days and you need to look very carefully.
Back to isotopes.
Isotopes are different versions of an atom. A methane molecule (CH4) is made of 1 atom of carbon (C) and 4 atoms of hydrogen (H). Some much less abundant methane molecules have a ‘special’ carbon instead, or a ‘special’ hydrogen. That makes them heavier, and that’s how we can measure how much of these heavier isotopes there are in the CH4 of an air mix. To put things into context, methane is emitted from different sources: ruminants, natural gas, wetlands, landfills and wastewater treatment plants, just to cite a few. While we’re quantifying methane elevations during mobile measurements, we can characterize the emission source by taking a sample for isotopic analysis. Measuring the isotopes precisely cannot be performed on-board of a vehicle because it requires a complex set-up (see my previous blog about the measurements in Krakow here). The samples are analyzed later in the lab.
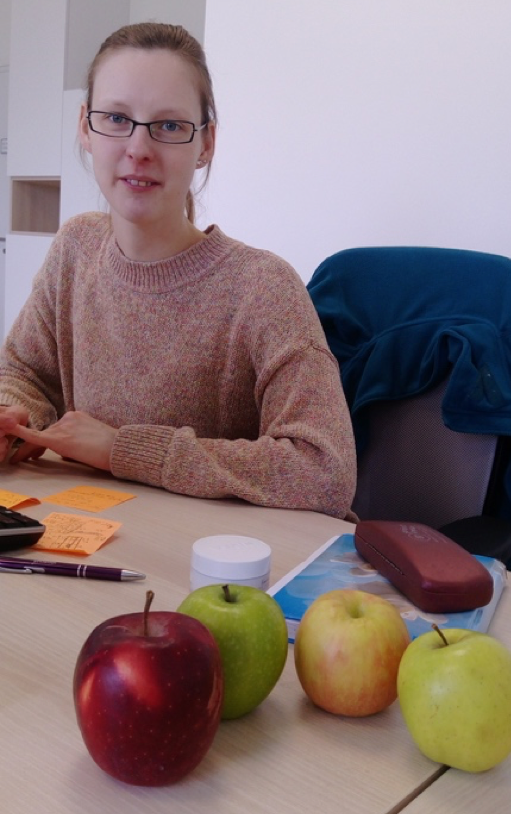
Barbara and the apples
This is a nice image: we quantify CH4 emissions like counting how many apples we have, but we characterise the emissions by looking at their different colours, indicating different origins, like the CH4 isotopic signatures.
On the map below are the locations where I have values of isotopic signatures, thanks to my MEMO2 colleagues! They have visited various sources during their own field work and sent samples for me to measure. With this collaboration, I could extent the isotopic dataset to better understand geographical variations in the isotopic signatures.
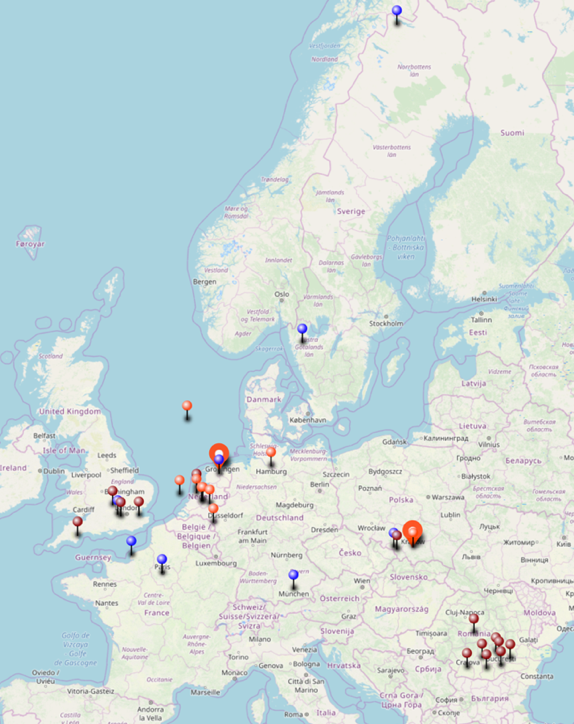 Sampling locations for isotope measurements. Colours indicate different groups and campaigns. |
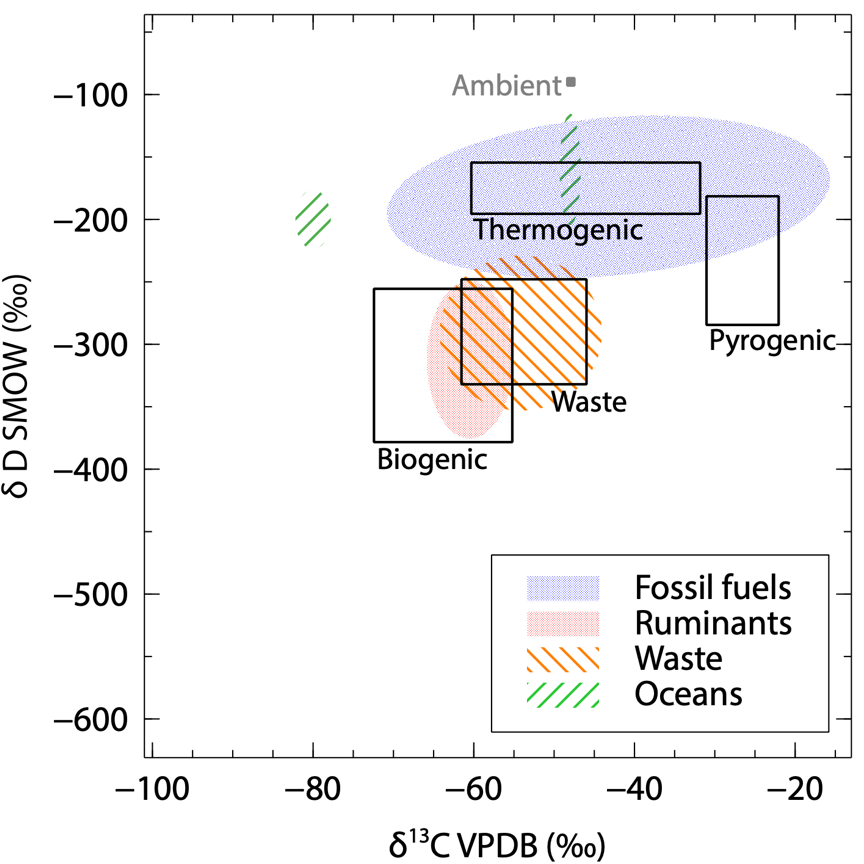 2-D isotope plot of the identified source signatures I’ve measured. The areas in black show literature ranges usually considered. |
From each location we’ve sampled, I could derive a source signature using measurements of 2 isotopes: deuterium (2H) and carbon 13 (13C). The most abundant isotopes in CH4 are 1H and 12C. We then measure how much 2H (also written D) and 13C there is in the CH4 of the sample compared to 1H and 12C. The results are expressed using the delta (δ) notation. It represents the variation in the isotopic ratio compared to an international reference material and is in per mille (‰). The CH4 source signatures are commonly represented on a 2-D isotopes plot, to make use of both δ13C and δD to identify the type of emission.
A first overview is shown in the 2-D isotope plot on the left side. This is preliminary data, and hasn’t been published yet as it needs further analysis. The results in this figure are only for the identified sources. During field surveys, it happens that we measure CH4 enhancements without knowing where the source is, and what it is. These signatures are not included here. Therefore, we can use this plot to update the literature isotopic values on the type of emissions. For example:
- We’ve measured a larger δD range of thermogenic (from fossil fuel operations) methane than before.
- The δ13C from wetlands gives indication that more isotopically depleted microbial emissions often occur.
- Emissions from the ocean apparently involve very distinct processes, including geological reservoirs (thermogenic type).
Adjusting these source signatures helps constraining the emissions in atmospheric models. We can compare the modelled results with atmospheric measurements time series at fixed locations, like we did for a dataset taken at Lutjewad, in the north of the Netherlands.
You can see how it looks in the graph below. It’s impressive, right? The atmospheric model, basically just equations, only uses emission inventories, meteorological data and the isotopic signature attributed to each source. Then it can reproduce the CH4 concentrations and isotopic signature we expect at that location!
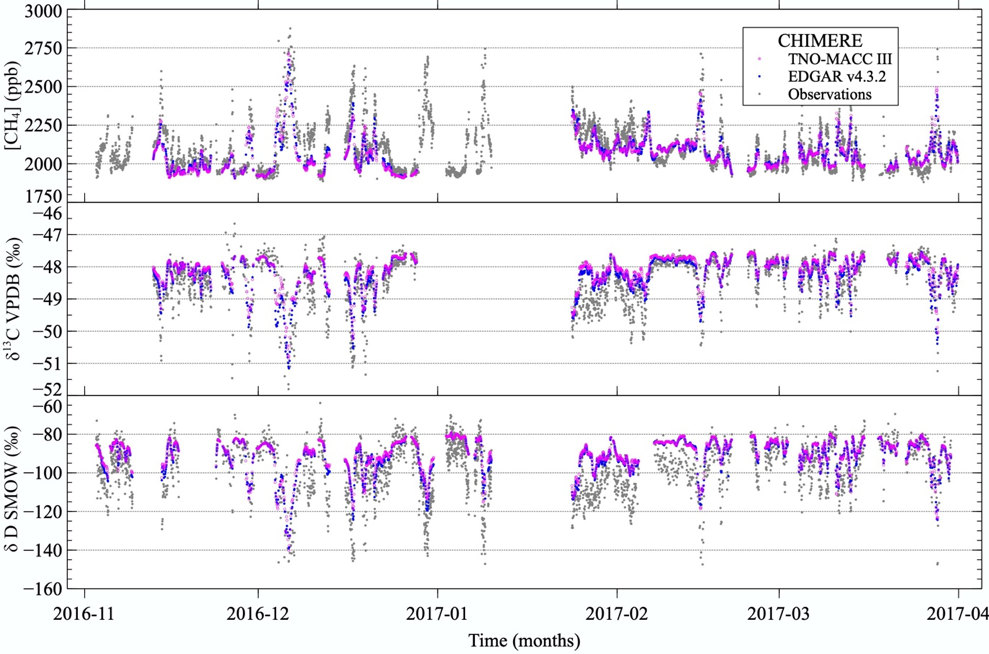
Time series of CH4 mole fractions, δ13C and δD taken at Lutjewad during 5 months, together with modelled data created by Barbara using the CHIMERE model, and from 2 different emission inventories (TNO-MACC III and EDGAR v4.3.2)
That’s it for the science. We’re expecting future exciting results from this collaboration at other measurement locations, so stay posted!
I’m usually traveling to go on the field for measurements, and this time I’ve worked form an office the whole time… quite challenging! So my daily field pictures are quite alike, but fortunately the changing weather made it quite entertaining!
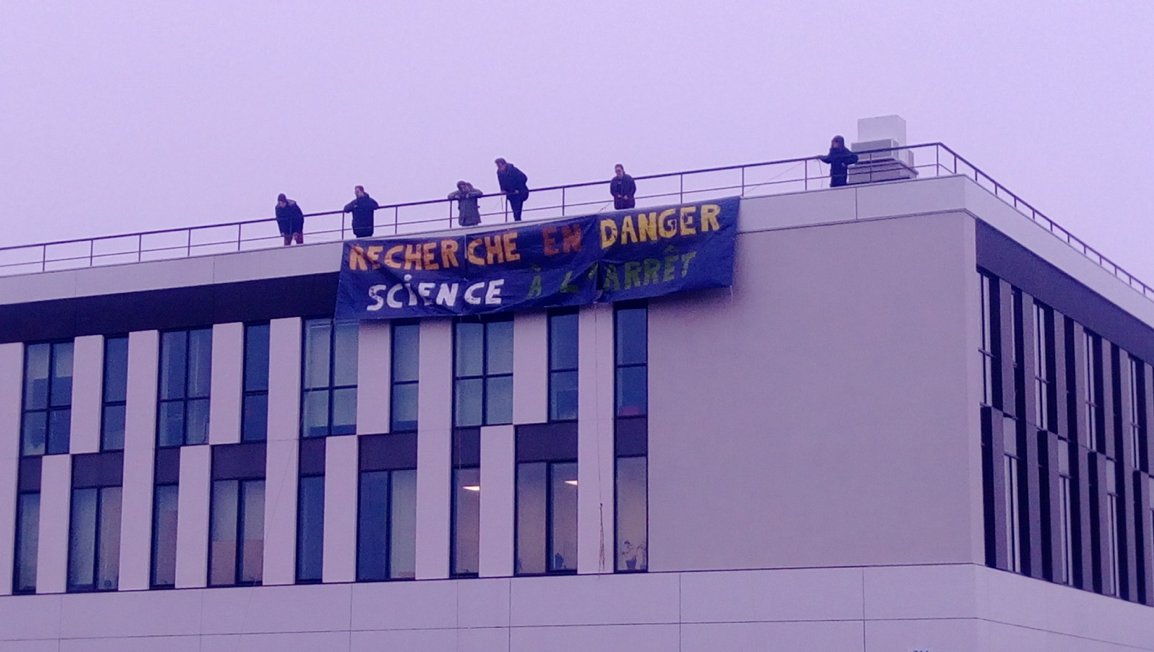 Another story showing a typical French experience: here is what I saw one morning when coming at the office. Researchers were protesting against a law that is currently being written by the government. It would favor short term contracts while reducing the number of permanent positions, increasing job insecurity. Research activities would be funded through calls for projects, targeting private funds. It would lead to an increase in the administrative load, and a loss of diversity in the topics (advertisement effects). Researchers actually ask for public, regular and unfailing finances. [1]
LSCE is a nice institute. A bunch of friendly and social fellow scientists (warmly) welcomed me in their lunch and after-work beer gatherings. It was also good to speak more French! Though it made me realize that I struggle to properly explain my work in my own language… I guess I should work on this a bit!
[1] source: https://www.liberation.fr/france/2020/03/04/un-projet-de-loi-contre-l-avis-de-la-recherche_1780608(in French)