ROMEO – City campaign – part 2

While writing this blog, the city campaign has already ended and our colleagues from Royal Holloway in London and Utrecht University are safely back home, with a huge collection of data and samples to be measured at their home lab. It was a great pleasure to work together with the colleagues from INCAS, a huge thanks for their professional scientific contribution and local support. We are really looking forward to the next part of ROMEO, which will start soon!
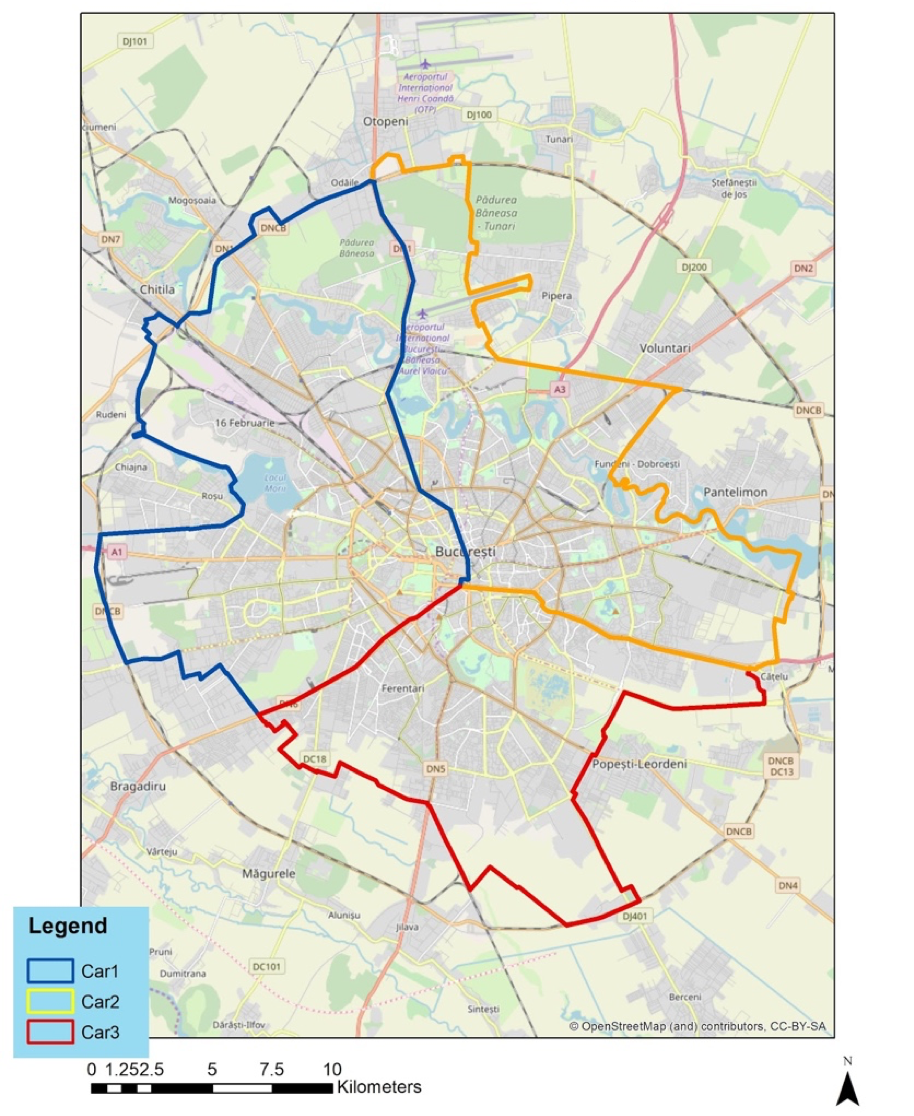
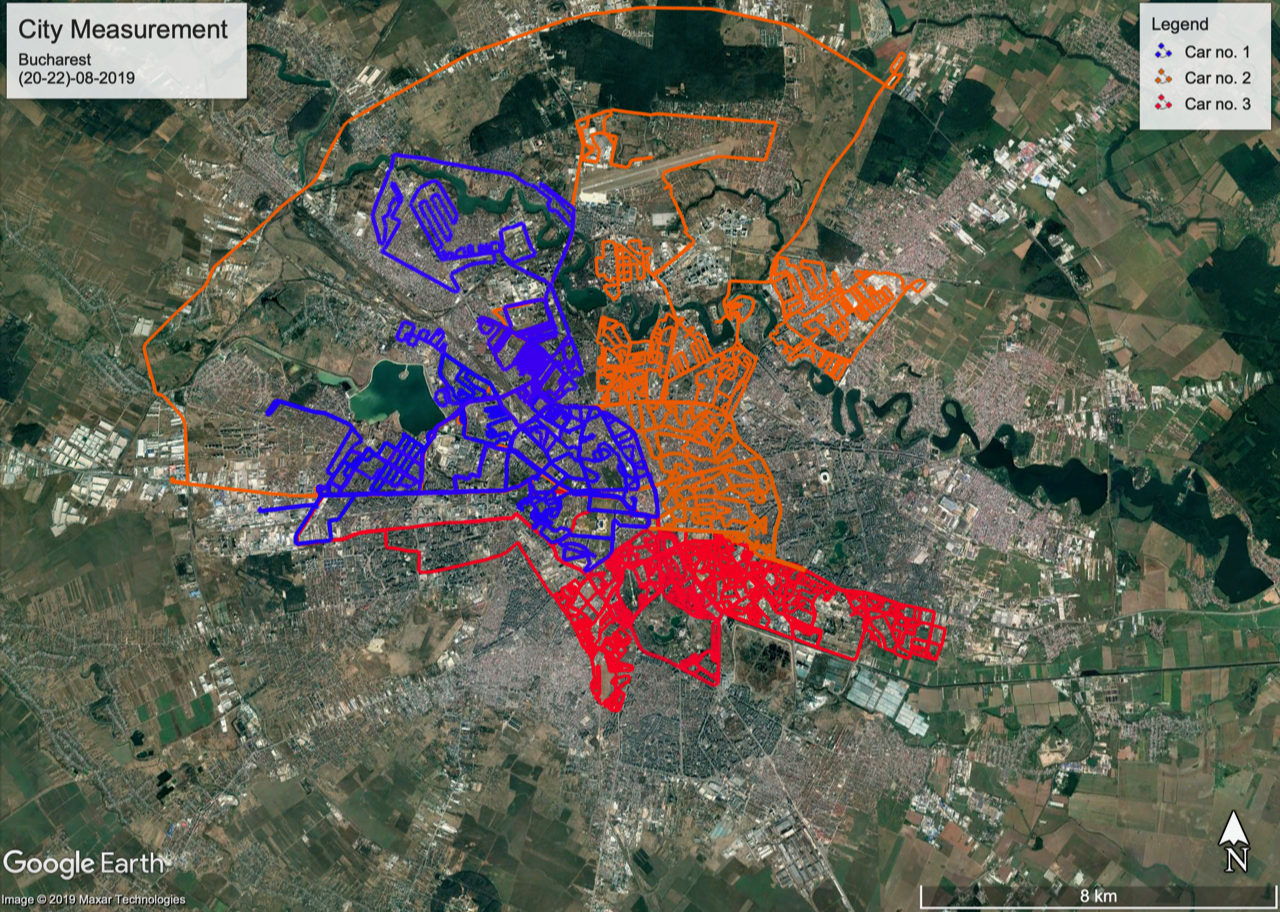
But first about cruising through the city. Bucharest, with almost 2 million inhabitants and more than 200 km2, is the biggest city in Romania. To ensure a representative coverage within the short measurement period we had, the city was sampled not only by one but by three cars at the same time. Each car got its own district for measuring CH4, and at the end all data together will be combined to give an overview picture of the city emissions.
 |
 |
|
Figure 1: Subdivisions of Bucharest for the three cars |
Figure 2: Areas covered after a few days of measurements |
As we are using different instruments, it is absolutely necessary that all instruments are correctly calibrated, which means that we know the exact output of the instruments with respect to given standards. A good calibration of instruments and also inter-calibration between instruments is an indispensable basis for reliable and comparable measurement results! So the teams spent quite some time on this before they started exploring the city.
 |
 |
|
Figure 3: Gas cylinders with different calibration standards. |
Figure 4: Calibration of in-situ instruments from INCAS, RHUL, UU, and TNO |
Bucharest is an active city with a growing cultural scene, a broad mixture of architecture and a long history. So it was an interesting experience to not only focus on the CH4 emissions but also look around and explore the city itself. But although there is more than science, we were always remembered to it by the omnipresent infrastructure for the natural gas distribution. In 1941 the first natural gas pipeline was constructed from Măneşti to Bucharest, while in the following year a main pipeline was built for the transportation of natural gas coming from Transylvania.[10]
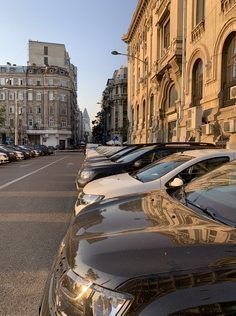
Figure 5: Buildings and streets in Bucharest |
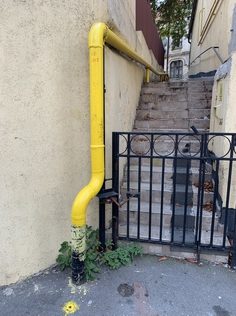
Figure 6: Natural gas infrastructure in residential areas |
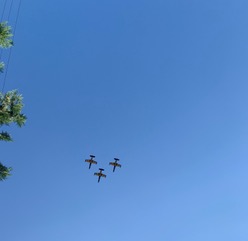
Figure 7: Caught a glimpse of the national air show during the surveys |
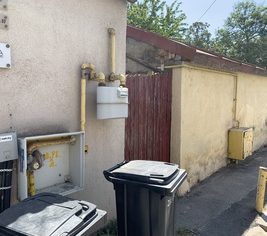
Figure 8: Natural gas infrastructure in residential areas |
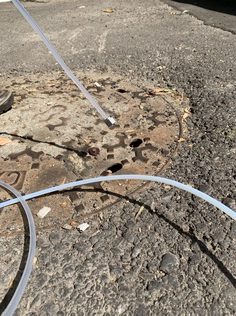
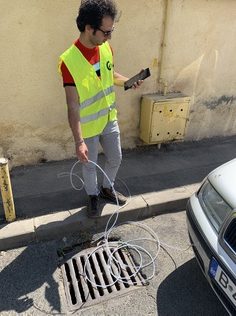
So we spent a lot of hours in the cars, driving around and made people curious about what we were doing. Or what would you think when spotting people who put tubings into a gully cover? Right!
|
Figure 9: Extension used to track down the location of leaks
|
Figure 10: Hossein looking for leaks
|

Figure 11: In-time checking of results (or satisfaction of curiosity) |
Figure 12: Another successful measurement day finished! |
But we did not only spent our time in the car! As the campaign also include the aircrafts of INCAS, Juli already tested her qualifications as our next pilot! And last but not least, as a scientist on tour there is also more: Packing and shipping, which clearly indicate the end of the sampling! But this does not mean the end of the work, in contrary…. It is just shifting location and means start measuring at the home lab, evaluating data, write your papers…
Thus, to be continued…
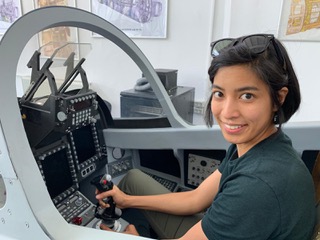
Figure 13: Juli in an INCAS cockpit mockup after a survey |

Figure 14: Just a few of the sample collection which will be measured at the home lab. |

Figure 15: Everything is well packed, so hoping to get it as is back after shipping. |
|


