
Blogs
Randulph Morales – Forward simulation of localized methane sources using GRAL
In our quest of learning how greenhouse gases behave in the environment, scientists around the world have develop sophisticated tools and instruments to help us see the gases that is invisible to our naked eye. Sophisticated measuring tools such as laser absorption spectrometers utilized the unique spectral signature of specific gases to detect its presence. Other than directly measuring greenhouse gases using high caliber equipment, another way to learn the behavior of greenhouse gases is through the use of different modelling tools. Most atmospheric models are based on the fundamental laws of physics that describes how different variables interact with the use of numbers and formulas. Highly accurate equipment and sophisticated models work hand-in-hand to explain how greenhouse gases behave in our environment.
In the context of the MEMO2 project, which is comprised of both methane measurement and modelling, we have used a modelling tool called GRAL to help us visualize how methane disperses from a local source. GRAL is a lagrangian dispersion model where virtual particles are released at prescribed sources, transported and advected using micrometeorolgy measurments as forcing.
A simple product that displays the capabilities of GRAL is shown on the video:
In here, 100,000 particles were released from a single source every second. The particles were advected using 1-minute averages of wind measurements from a 3D sonic anemometer set right beside the point of release. From the animation, one can see how methane theoretically spreads in a homogenous field. Since no buildings and other obstructions were placed downwind of the modelling domain, the shape of the methane plume always appear to be Gaussian.
Atmospheric and transport models are integral in understanding the behavior of dispersive gases like methane as it helps us plan efficient measurement campaigns. Likewise, results of the model are combined with available measurements taken using different measurement tools to properly quantify the emission of methane coming from the sources.
Quantification of methane emissions using UAV measurements
Traditional and current methods of methane emission quantification from facility-scale sources such as ground-based thermal imaging and tracer-release correlation are either expensive, intrusive, and/or time-consuming which limits the sample size of the measurements.
With the advent of unmanned robots and sensors, in-situ reporting of measurement using a methane analyzer mounted on the drone has been becoming popular. Drones are generally cheap, versatile, and easy to deploy compared to its larger aircraft counterpart making it attractive in measuring trace gases
Although UAV-based methane measurements are gaining popularity, methodologies and techniques on deriving emissions from sources using this platform is still lacking and now well established. Notedly, only a few methodologies have been established in quantifying sources using integrated UAV systems.
As the name suggests, MEMO2 does not limit itself from mobile measurements using automobiles, but also expanded our study to measurements obtained using UAVs. One of the aims in MEMO2 is to be able to develop the world’s lightest methane analyzer that can be mounted on drones, as well as to be able to quantify methane sources using this new technology.
We utilize the concept of the mass-balance approach in quantifying our methane sources. We have tested this quantification approach in various controlled-release experiments to characterize the accuracy of our system properly. A summary of our methodology is illustrated here:
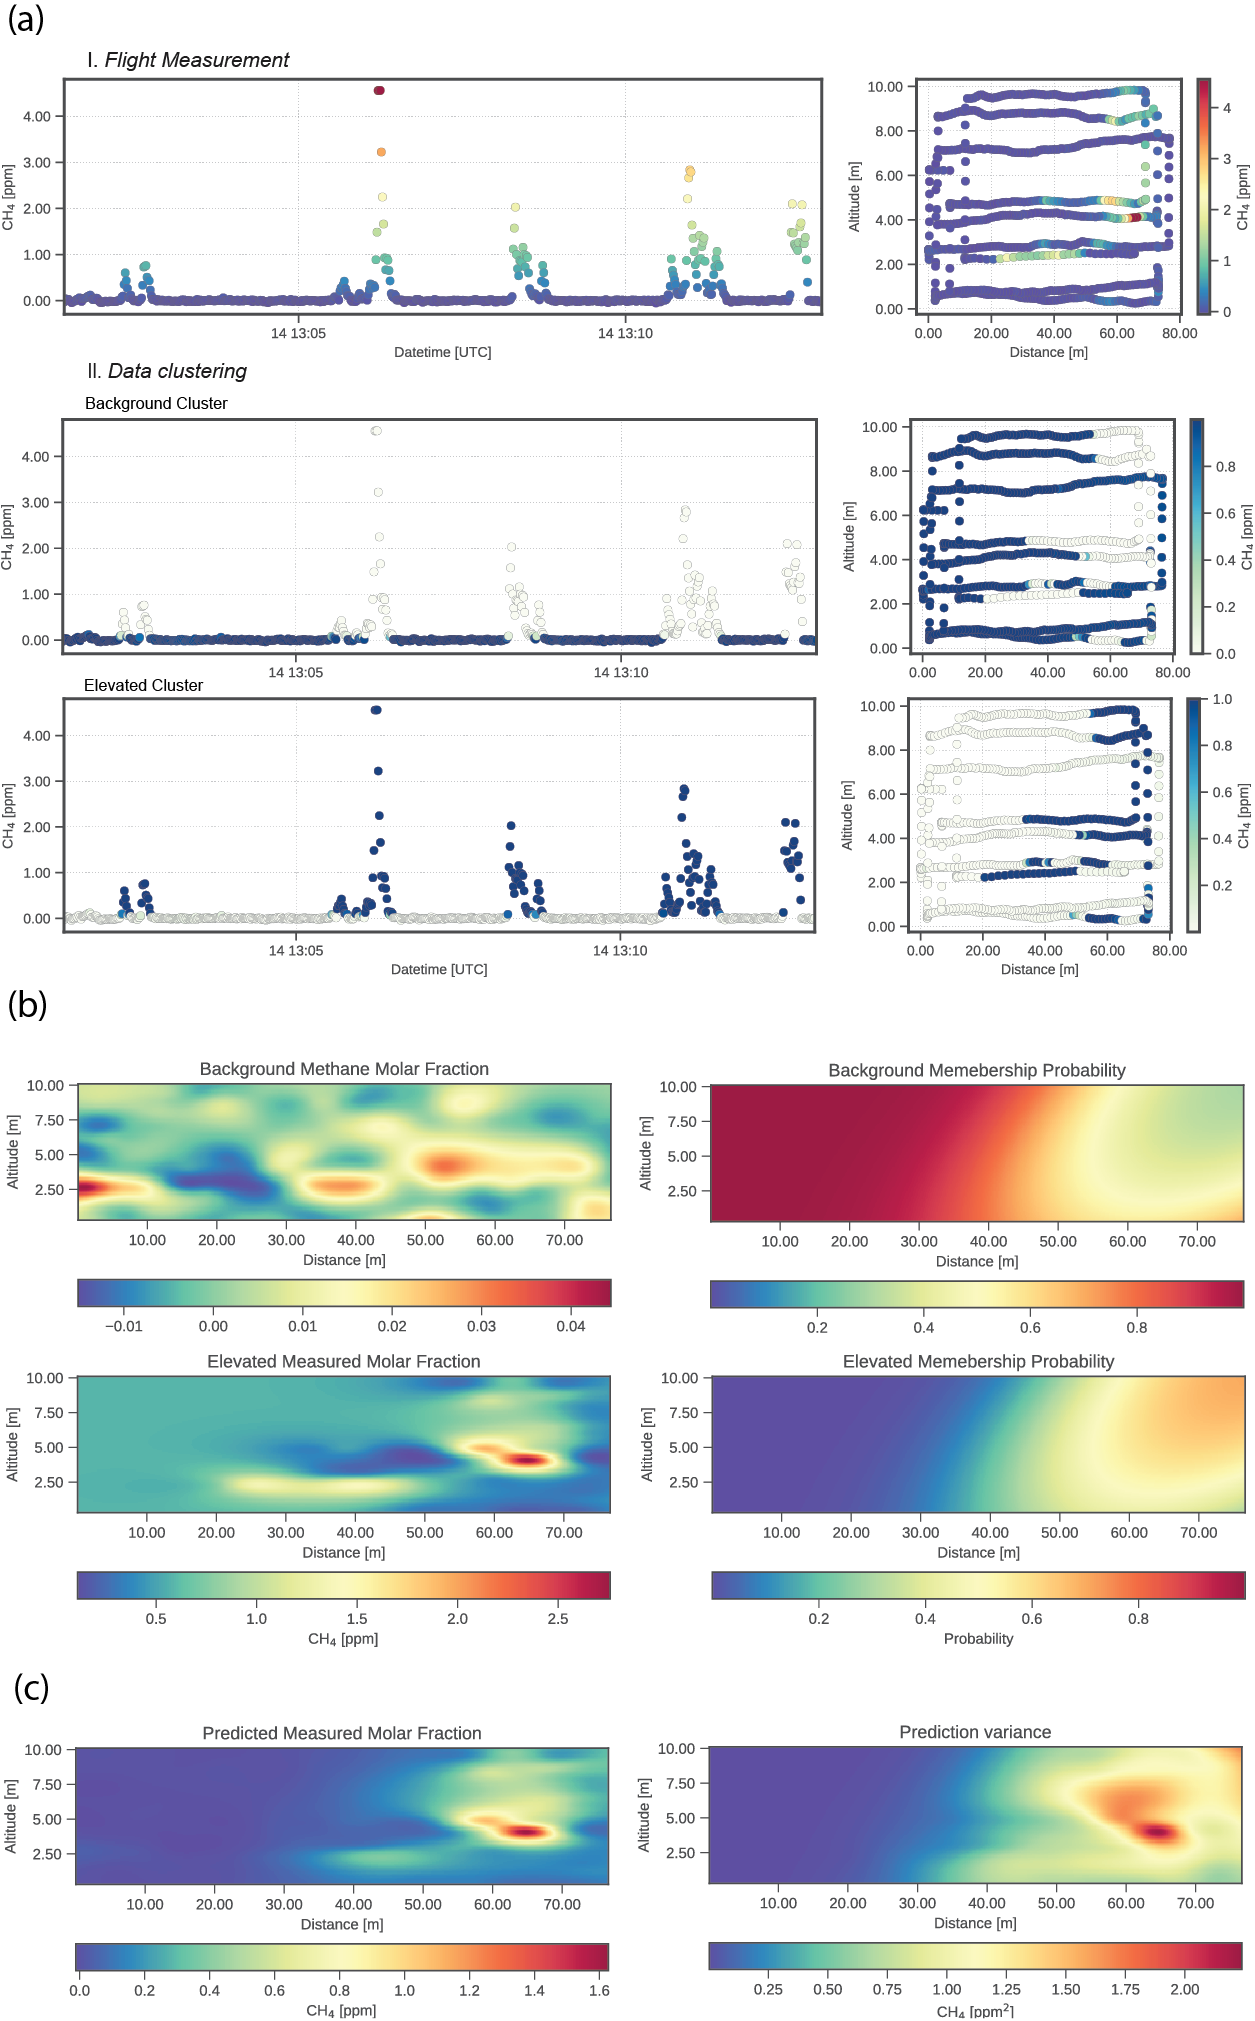
UAV measurements are classified into the background and elevated cluster complements each other. Kriging prediction and membership probabilities of each spatial point within the domain of interest for background and elevated clusters are then performed. Expected value and variance of methane molar fractions after combining kriging prediction of the two clusters and their respective membership probabilities.
This same technique was used in order to quantify oil and gas facilities in Romania during our ROMEO campaign. The results of our quantification approach is currently being written in a publication, and will be available soon.
To be continued….