Blogs
Piotr Korben – Is Paris a romantic city or a city of methane?
What is your first thought about this question? Is it a serious question? Is it a joke? Is it somehow connected with science? How? All these questions are correct and quite understandable. Let me show you some explanations. When we think about methane, probably we think about cows and coal mines, aaaaaaand this is correct, of course. But, not completely. We have also other methane sources like from landfills, from natural gas pipelines or from wastewater treatment plants. Especially in cities, we can find all of these and measure how much methane each one emits.
Why Paris? Why not? But to be honest, the trip to Paris was a part of my PhD. From the 25th of February, I spent almost 4 weeks on my second secondment. The previous one was in Poland, but this time in the capital of France. To be more precise – almost Paris, because my work site was a bit outside of the city. Specifically, the working place was LSCE – Laboratoire des Sciences du Climat et de l’Environnement (https://www.lsce.ipsl.fr/). My host there was Sara Defratyka, a PhD student from MEMO2. At the same time, another PhD student from MEMO2 was also making her secondment there, Julie Fernandez from RHUL group. The plan was quite easy: 2 weeks doing methane measurements and 2 weeks doing modelling. Does this sound easy?
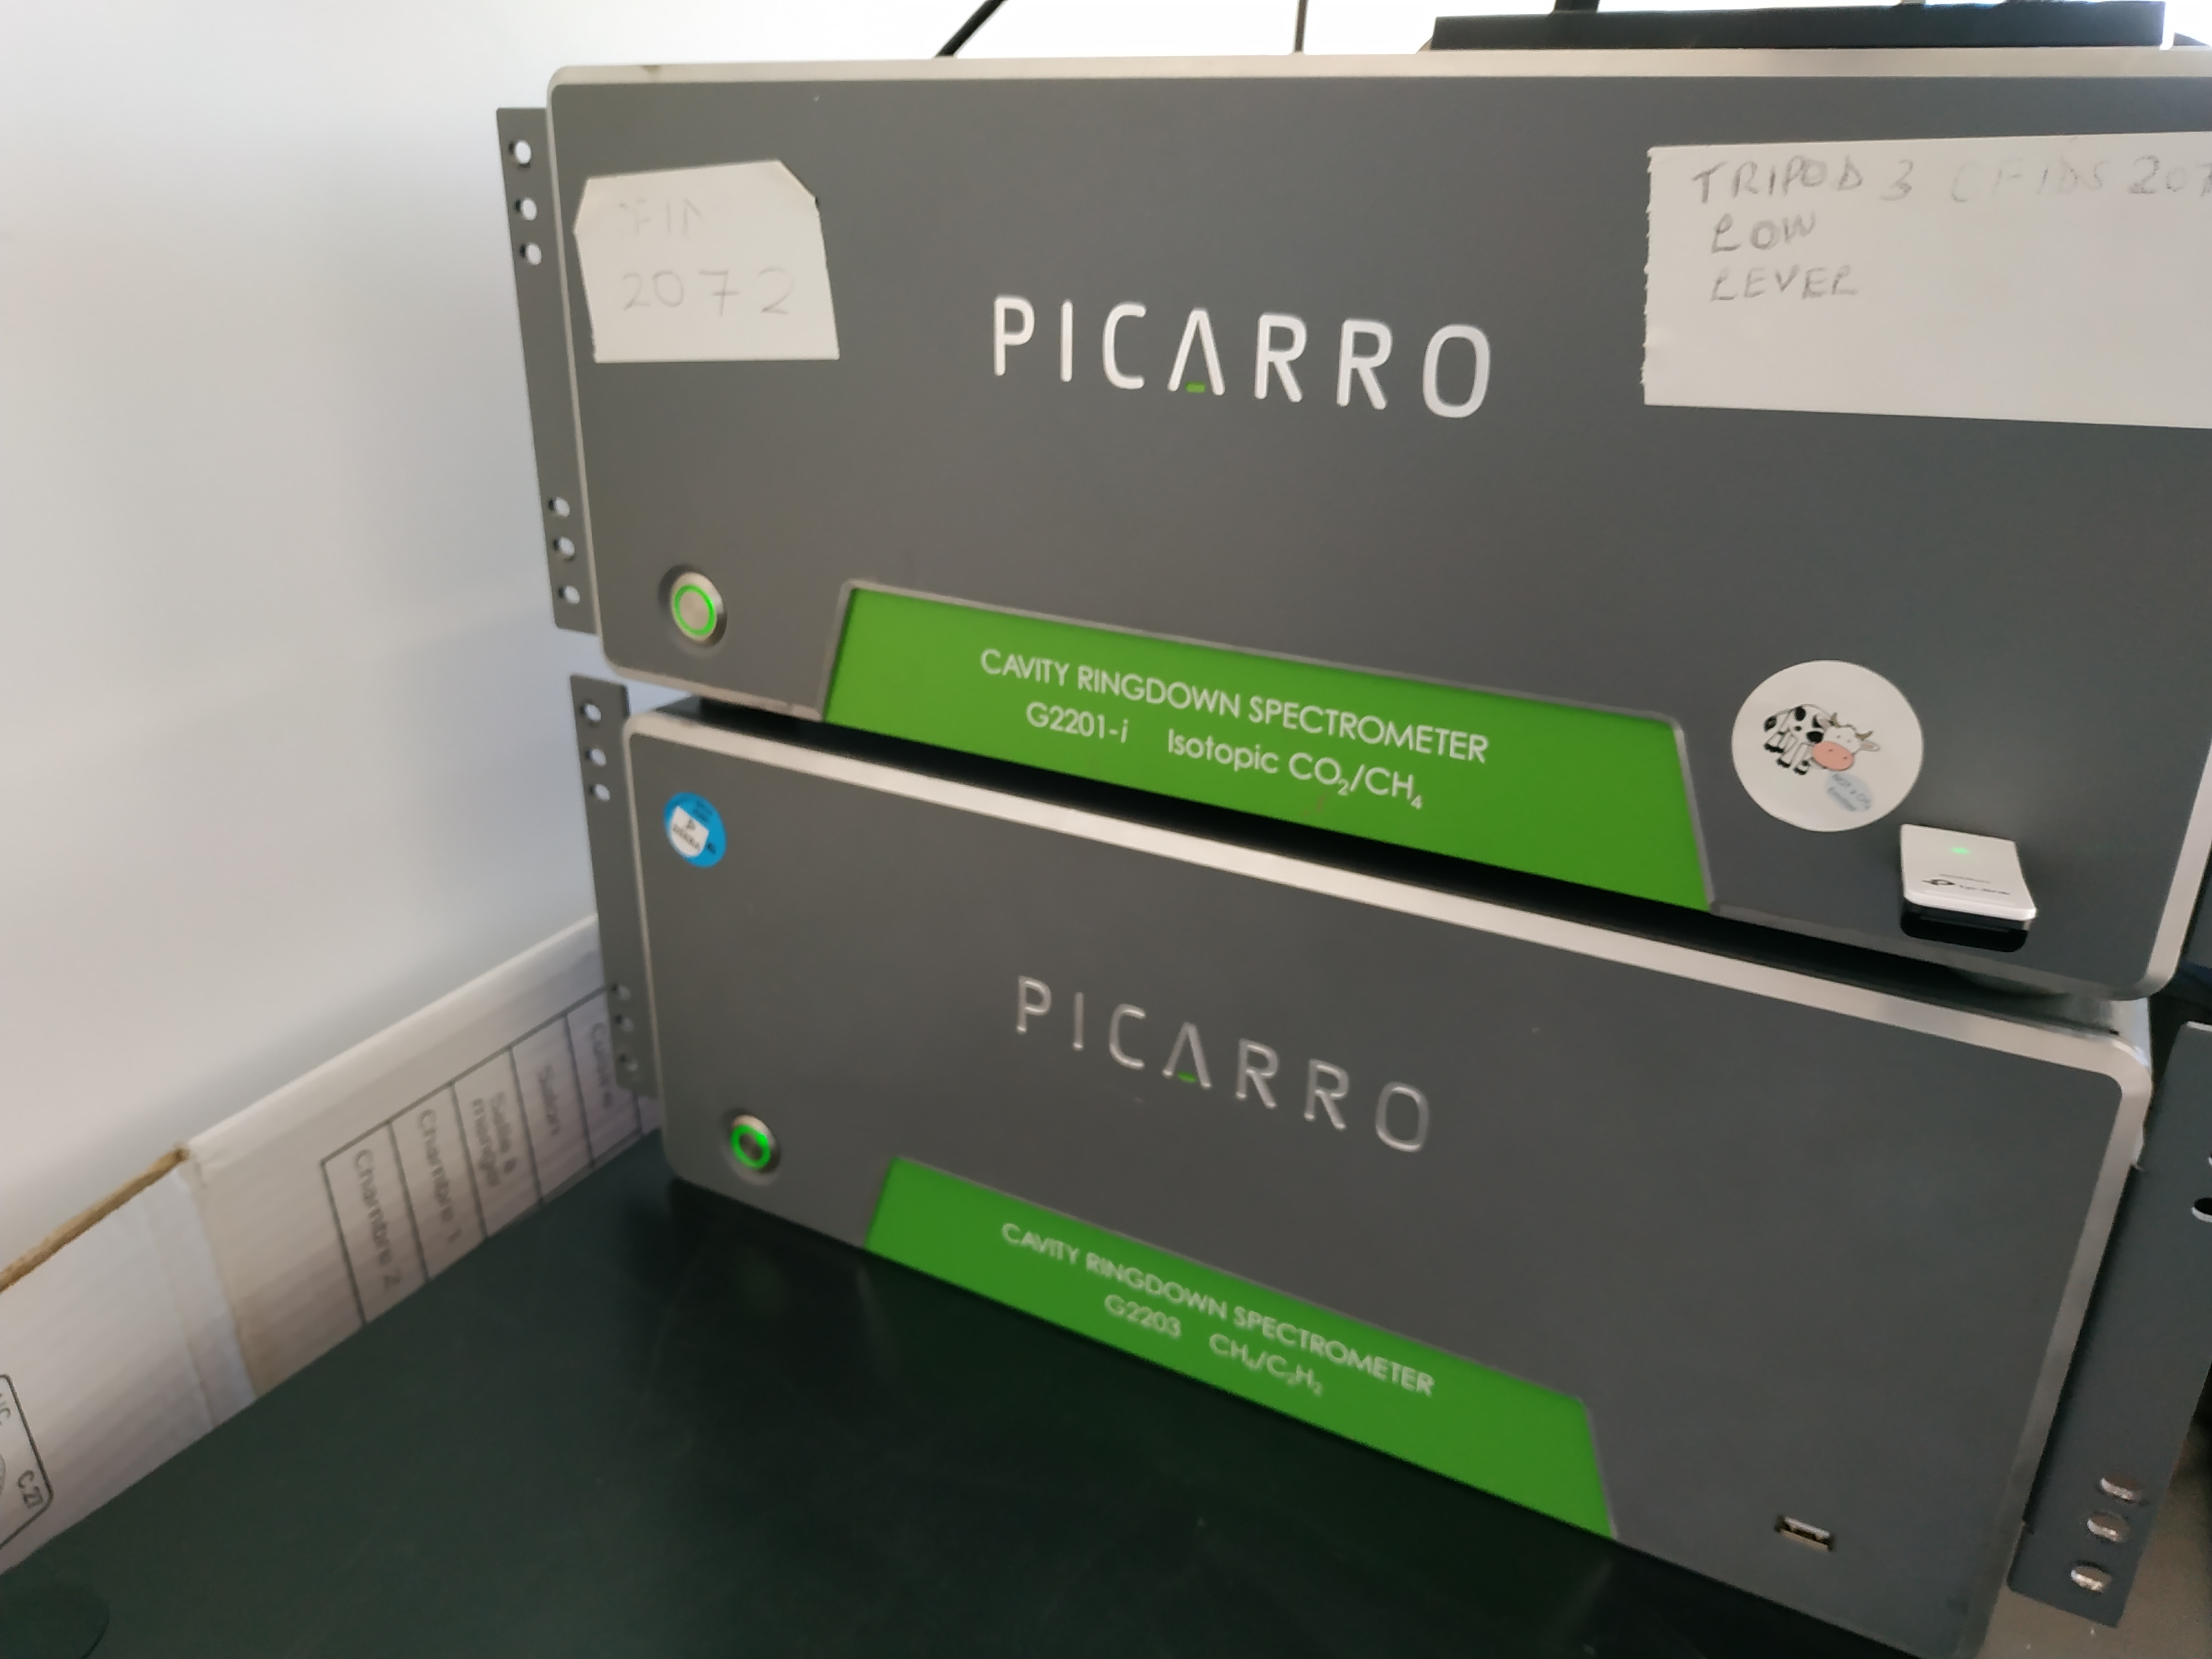
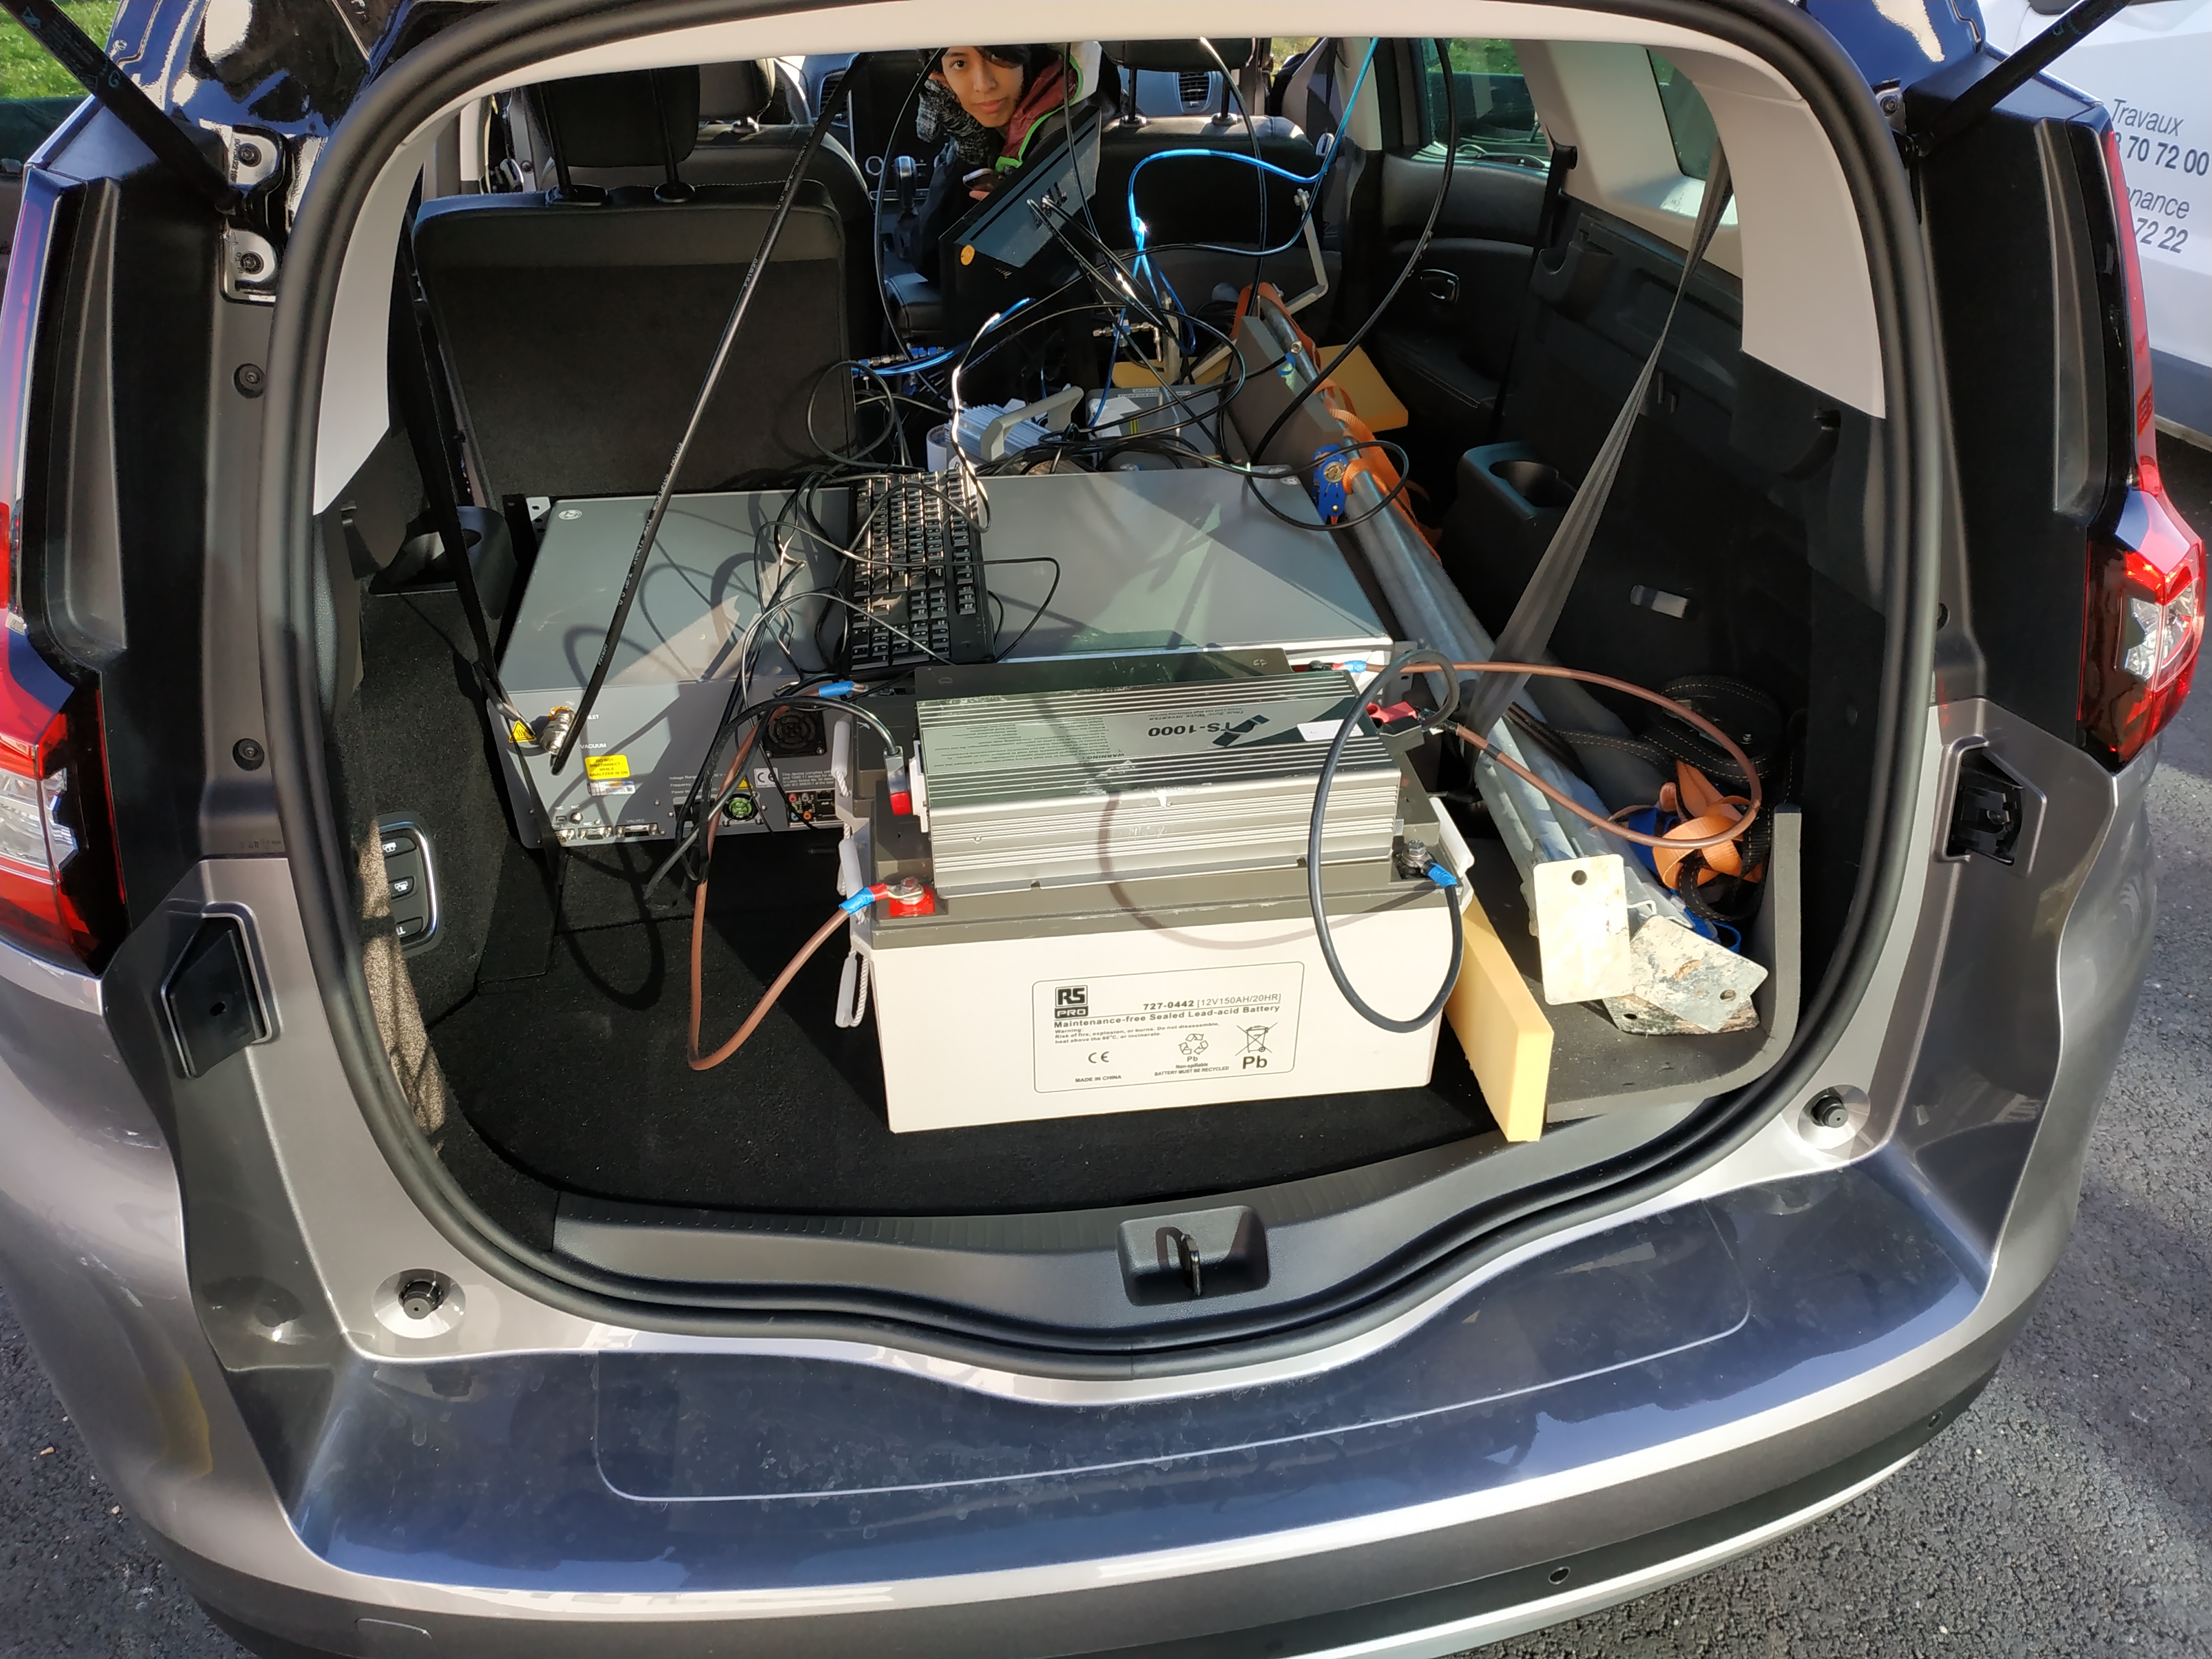
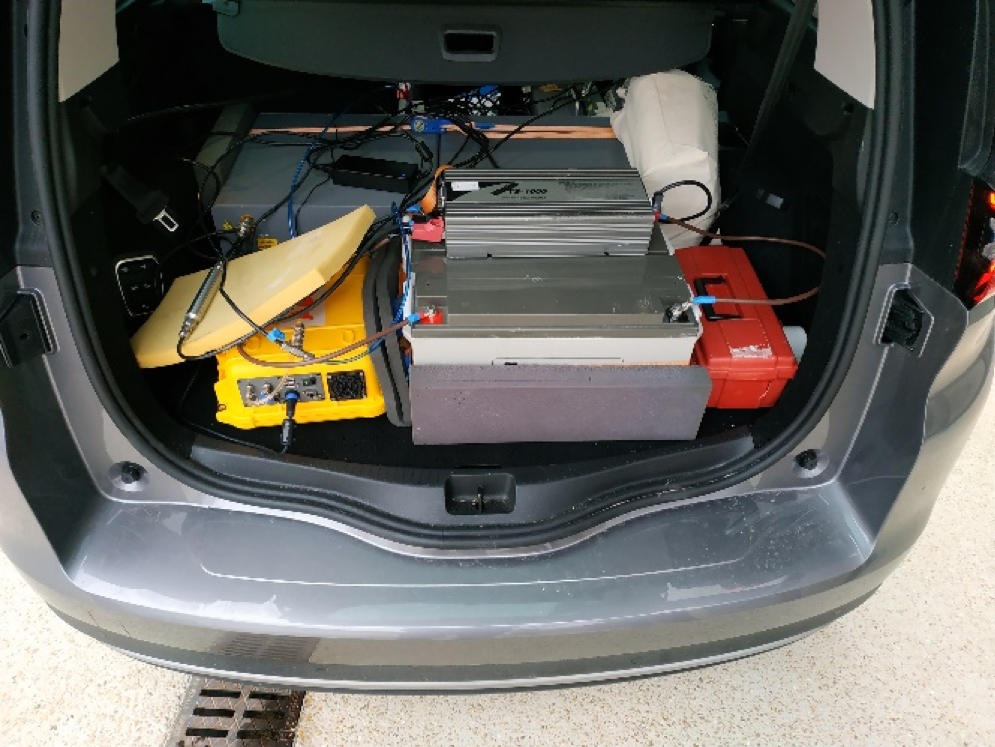
So, we started with the introduction. Sara showed us the laboratory and all the equipment. It was more or less the same equipment that I have in Heidelberg: a car, analysers, batteries and a weather station. We met a lot of new people; her working group is really big.
 |
 |
|
Fig. 1: Pictures above show the equipment: 2 “computers”, and how these were packed into the rental car. |
|
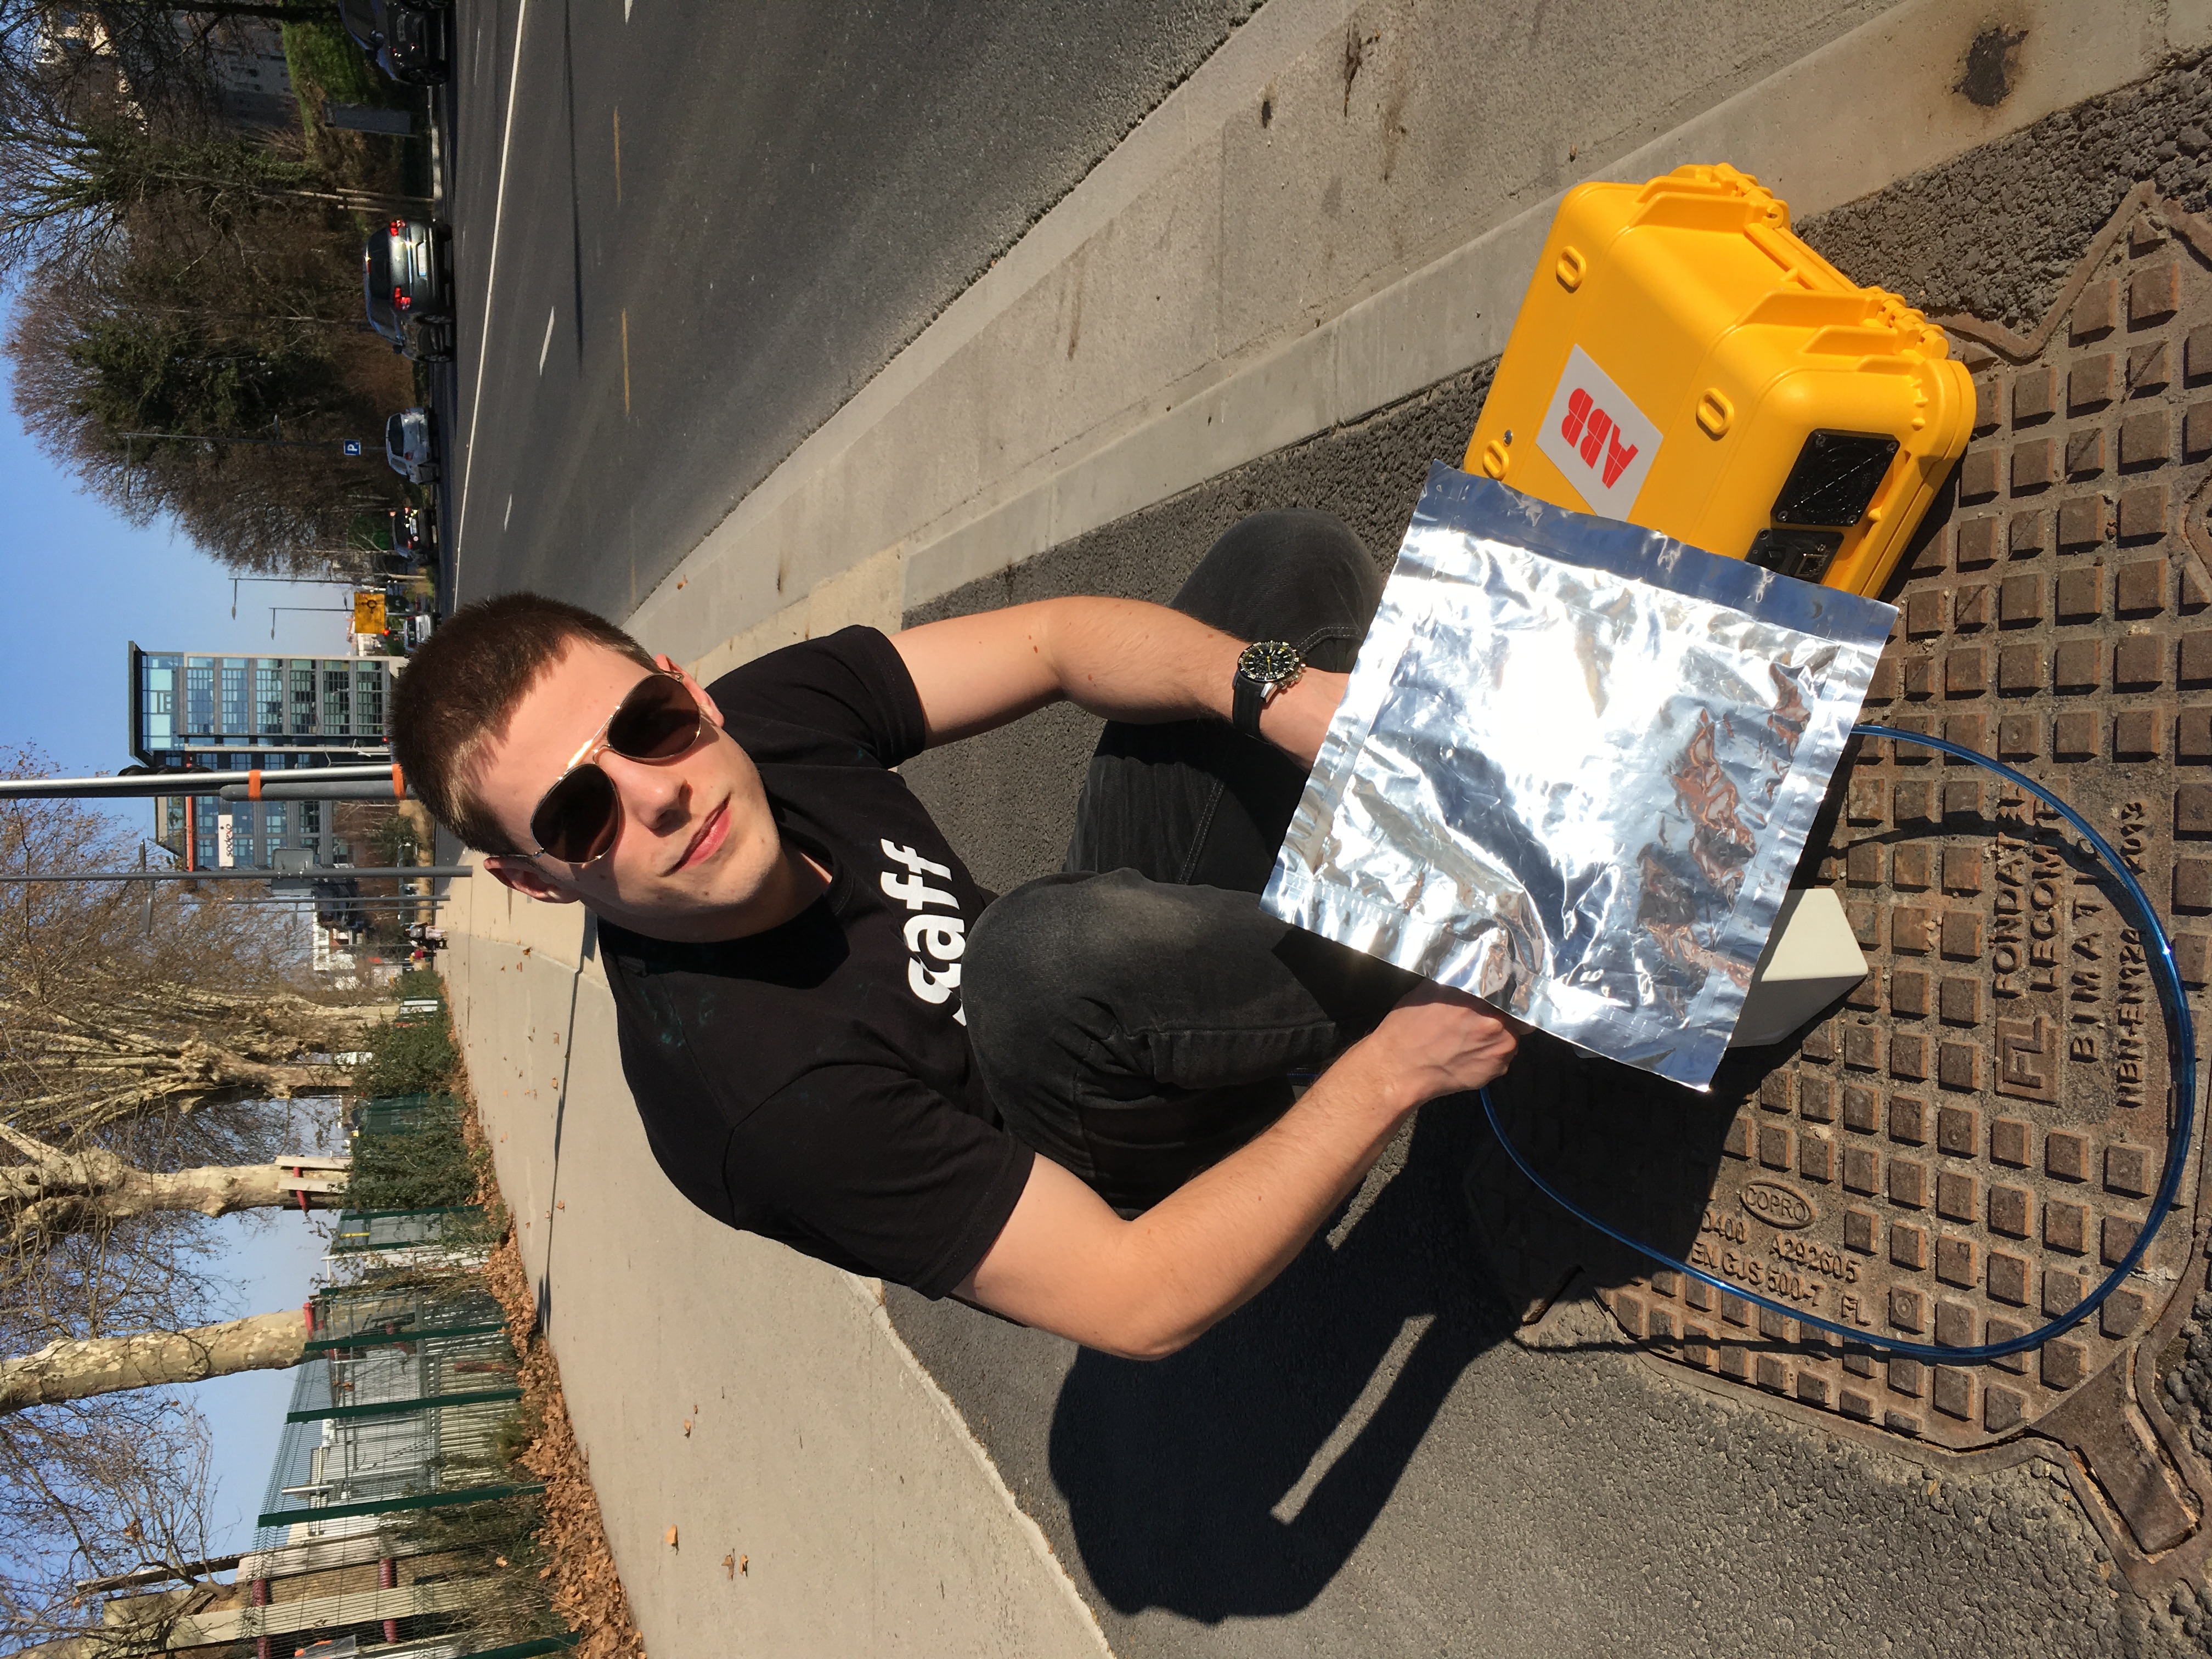
On Tuesday, we started our measurements. We decided to go to Issy and Boulogne. These are urban areas around Paris. We measured methane in these two small cities. Our goal was to drive through the cities and find methane sources – to be more precise, to repeat the measurements, which Sara had already taken. So, we drove through these areas and at places where we observed methane peaks, we tried to stop the car (something that was not so easy in the metropolitan area of Paris) and take some bag samples for Julie. We used the portable analyser and collected samples. These measurements were focused more on isotopic data in order to determine methane sources.
 |
 |
|
Fig. 2: Sampling on the street with Julie. Sometimes we measured quite a lot of methane. |
|
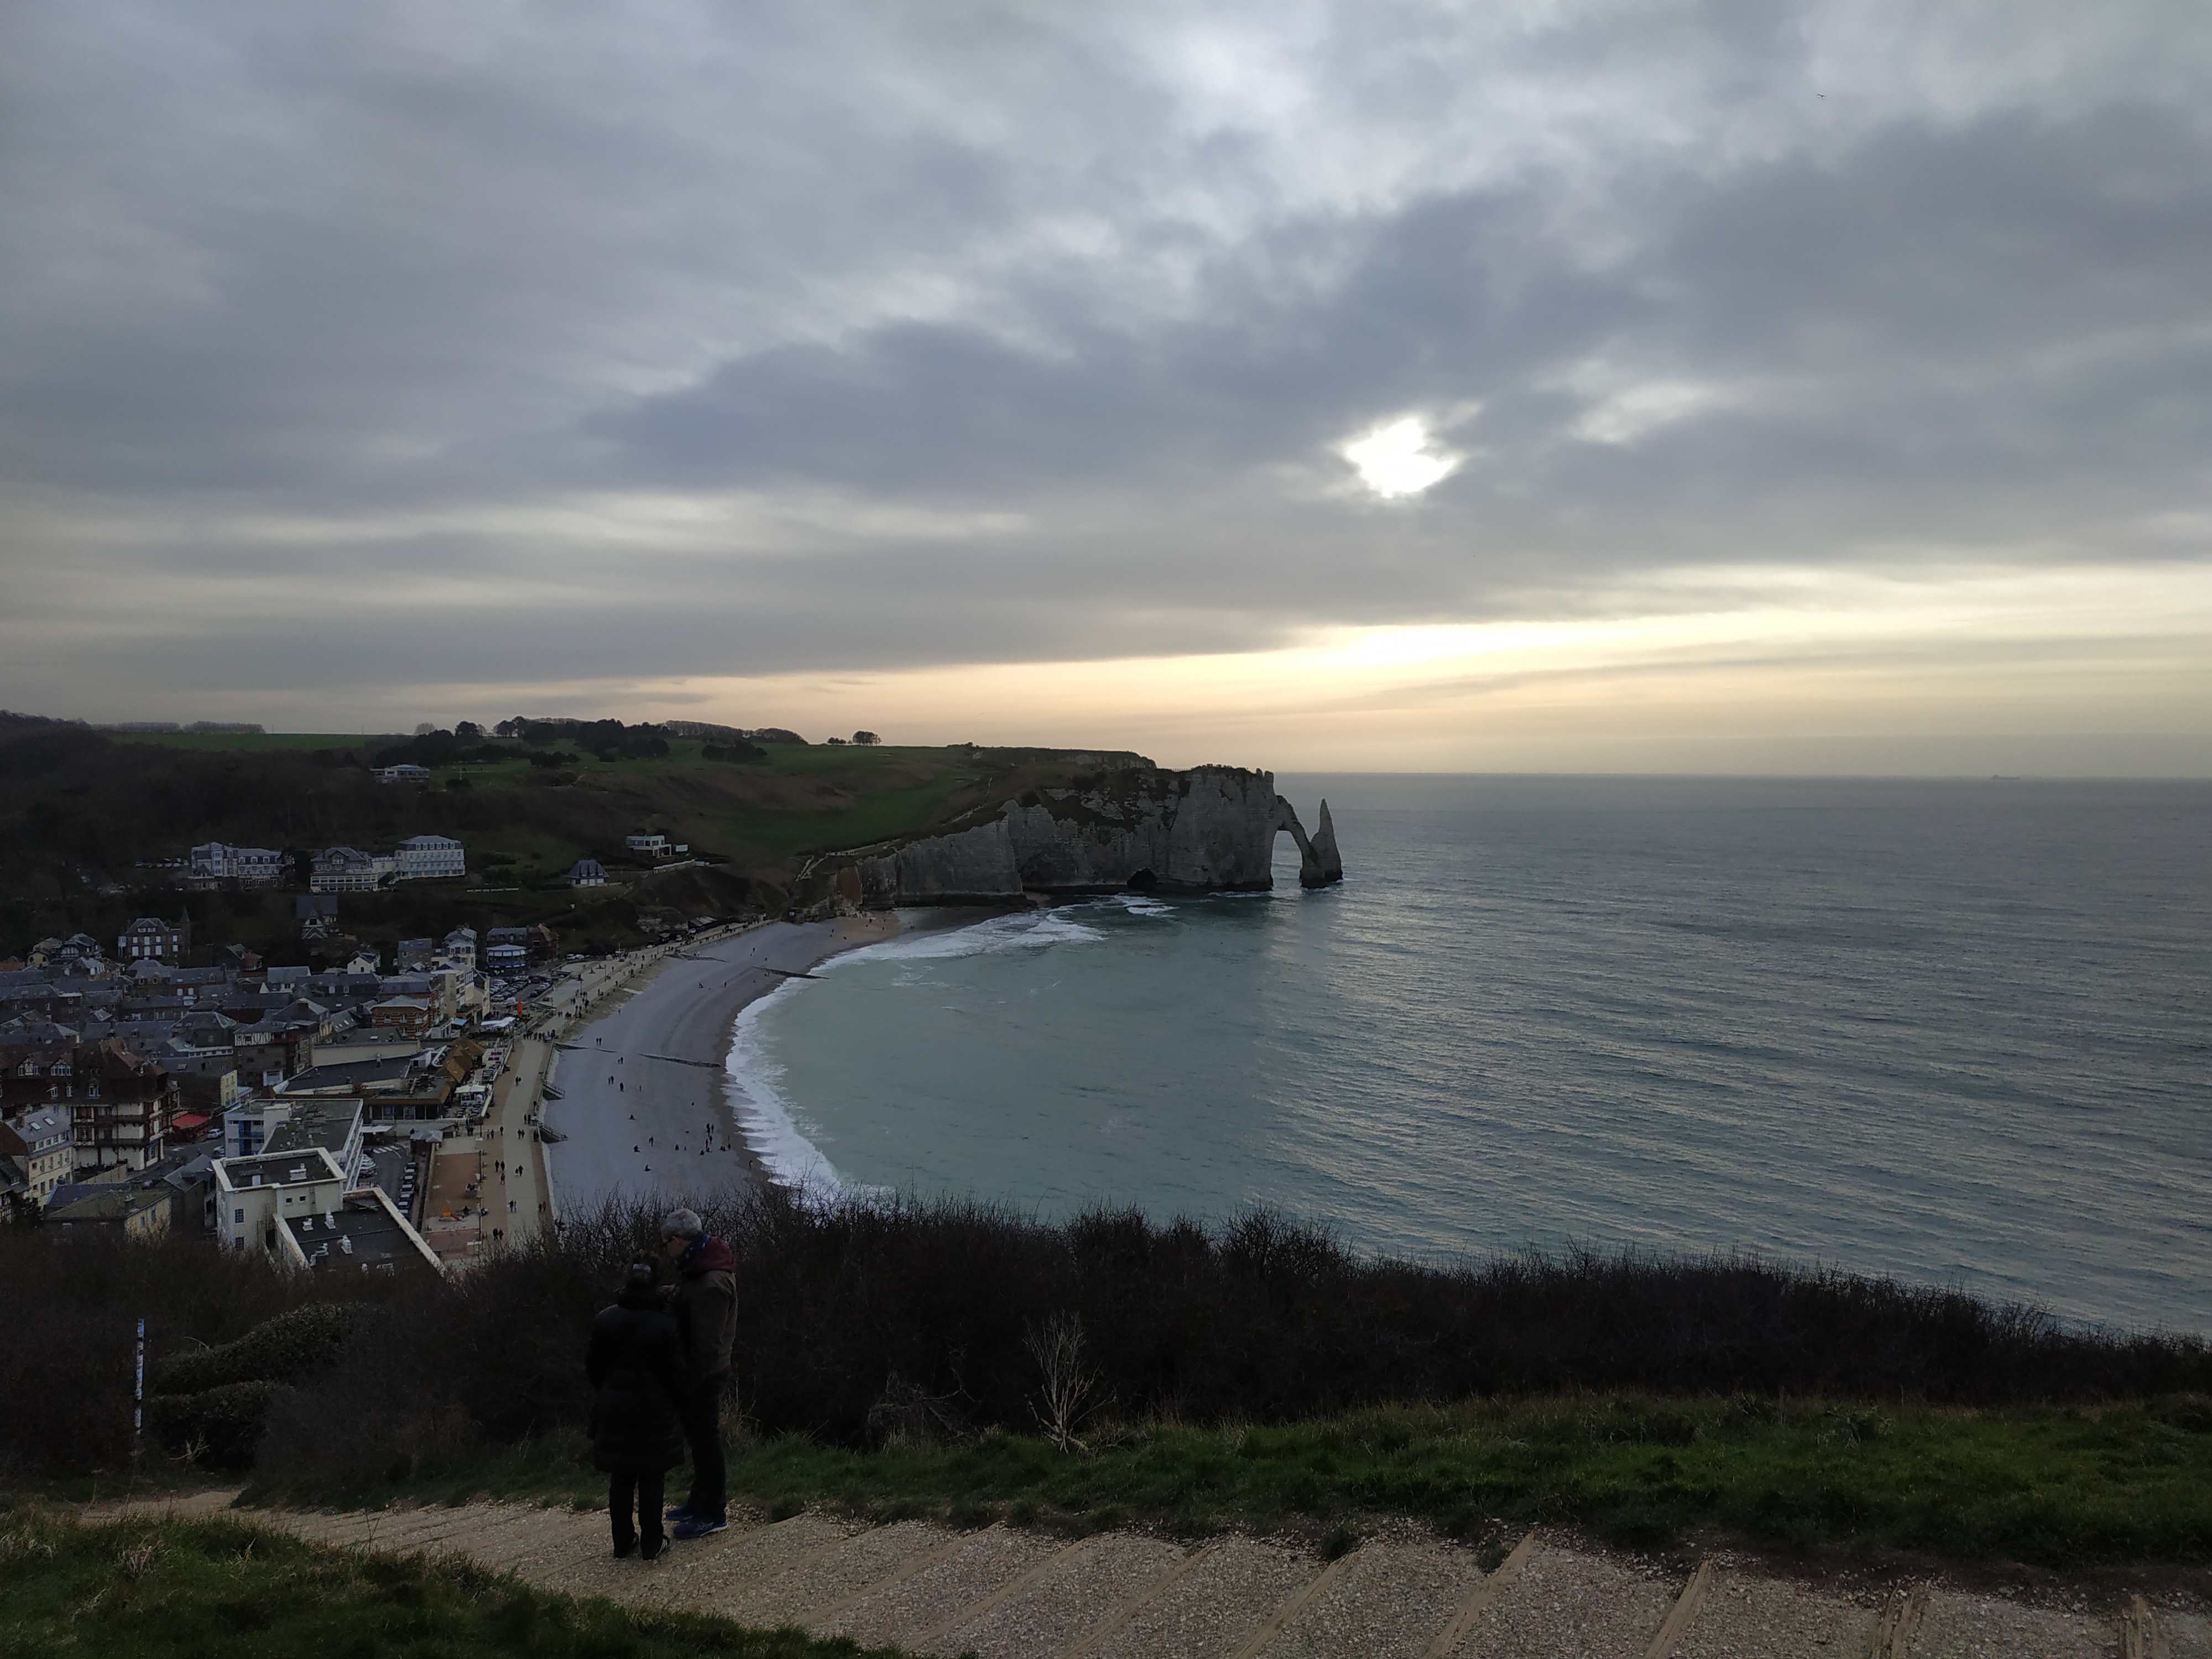
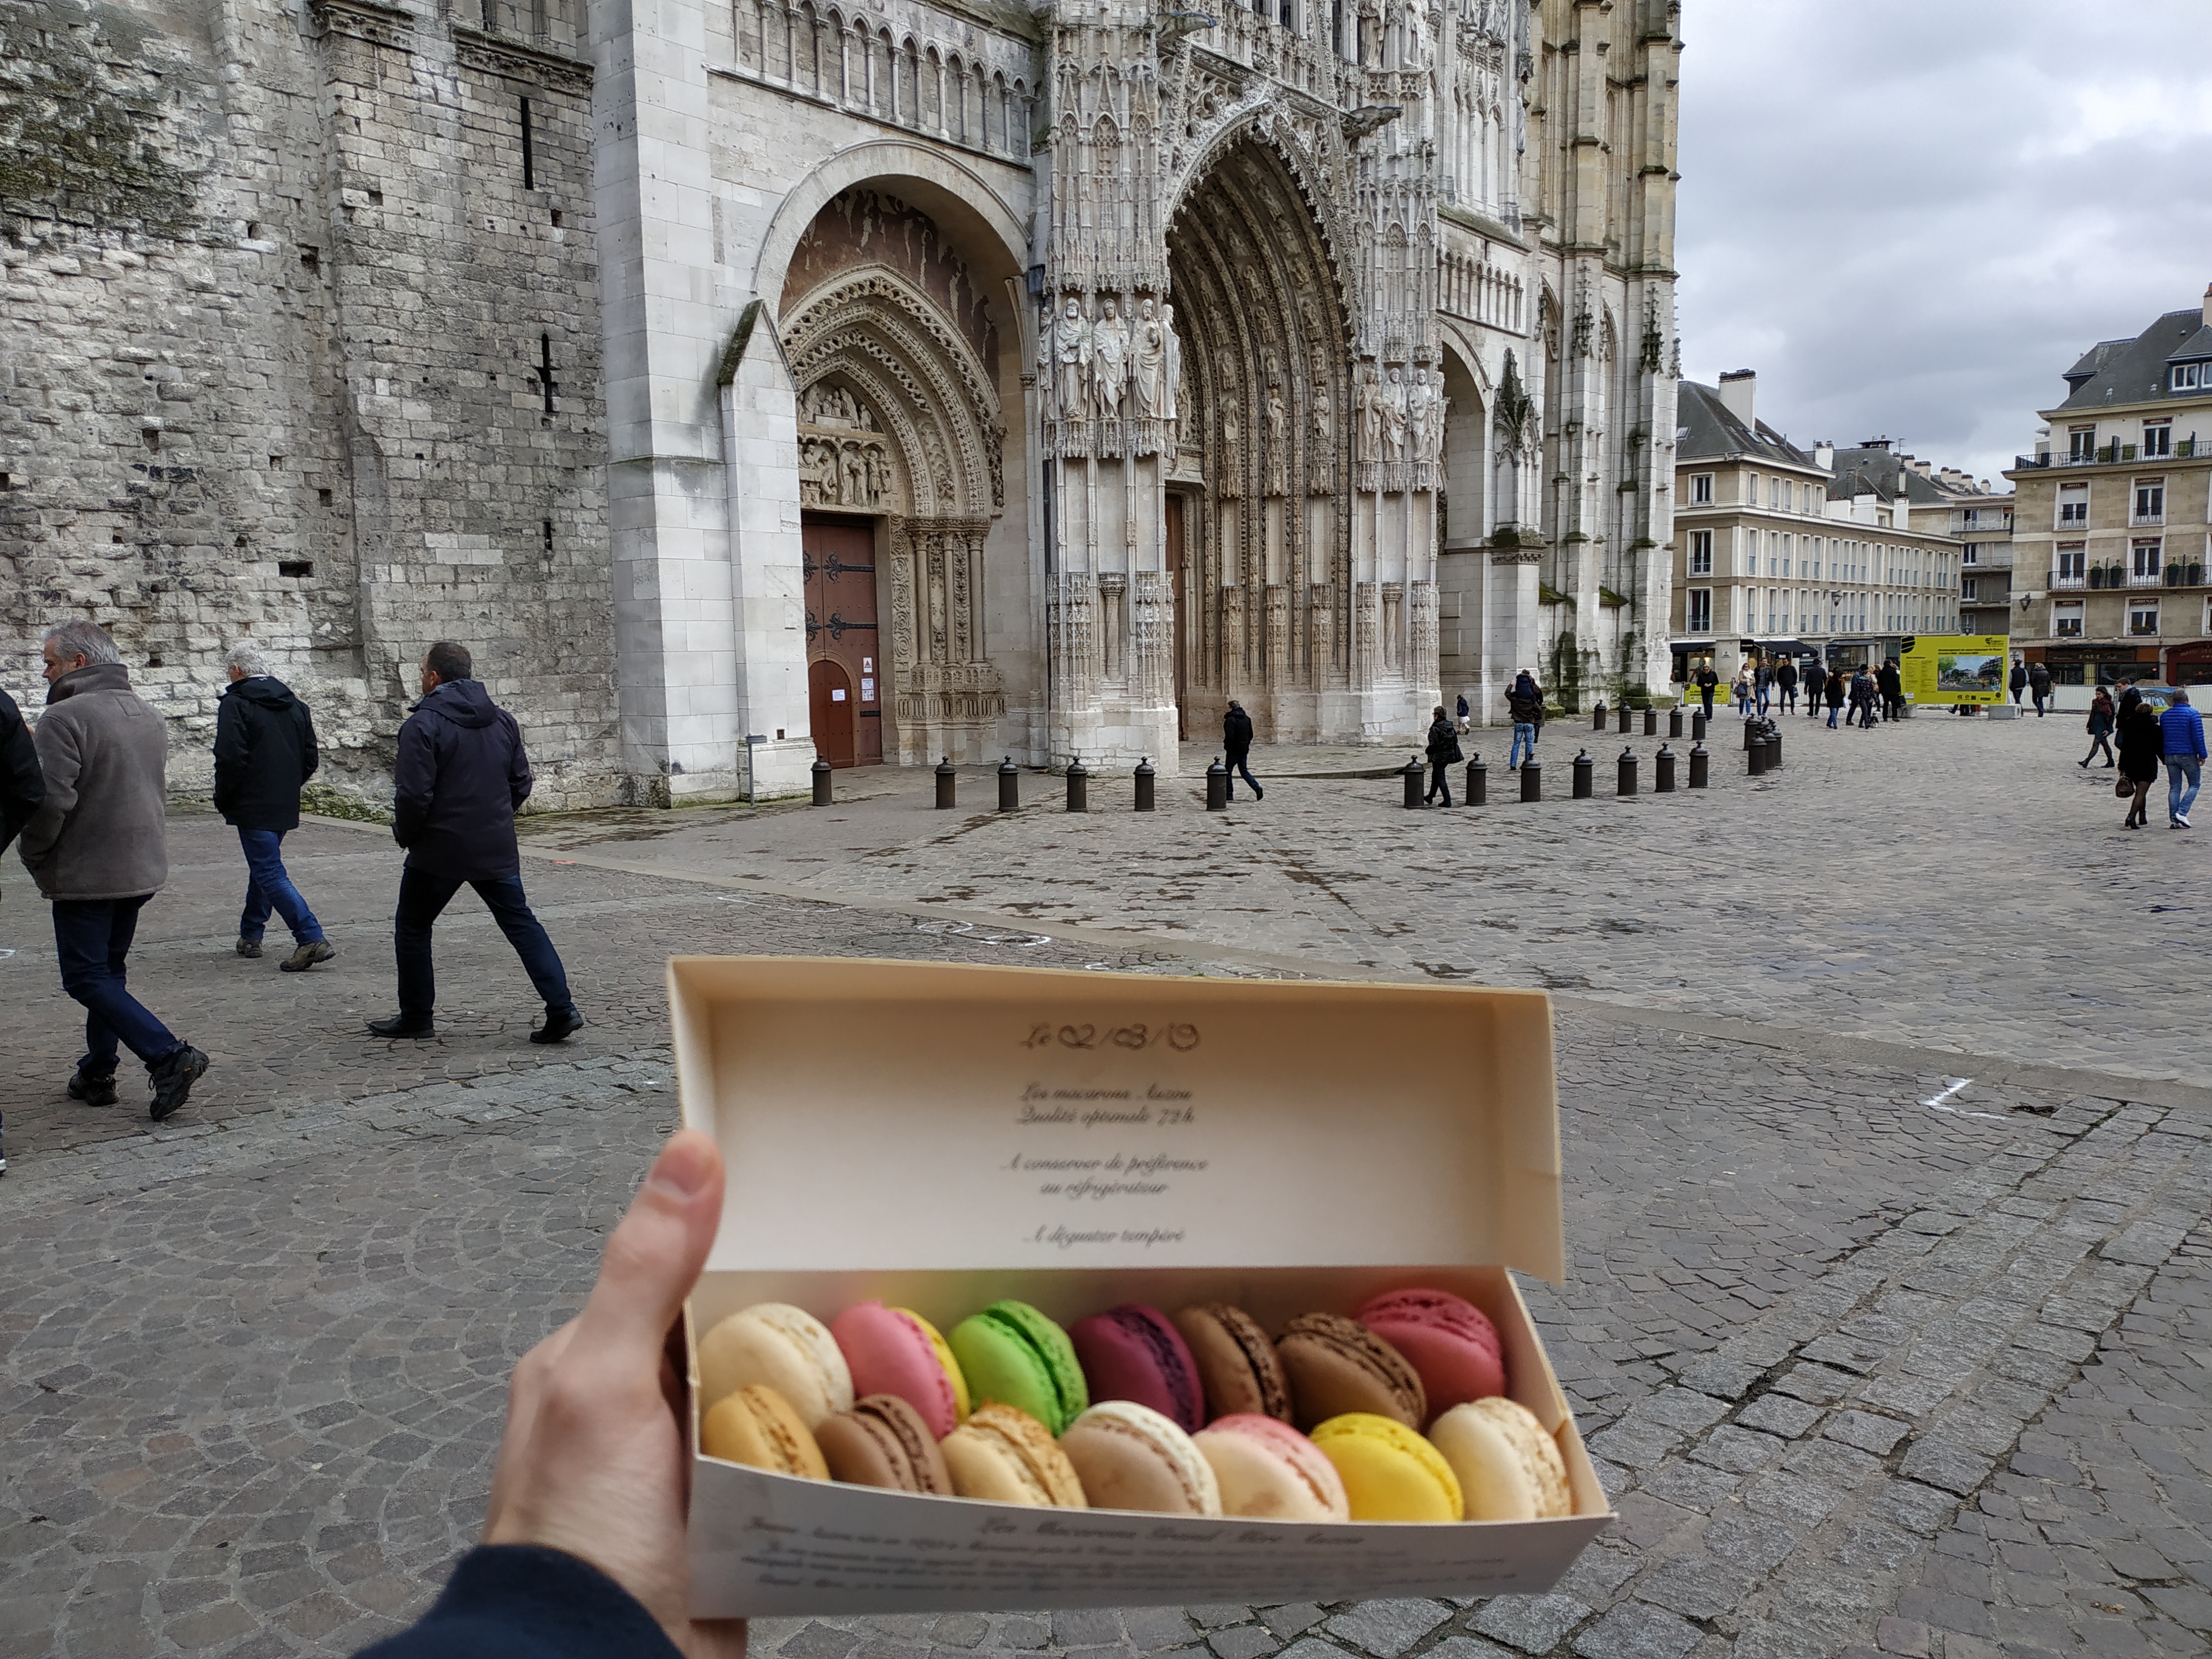
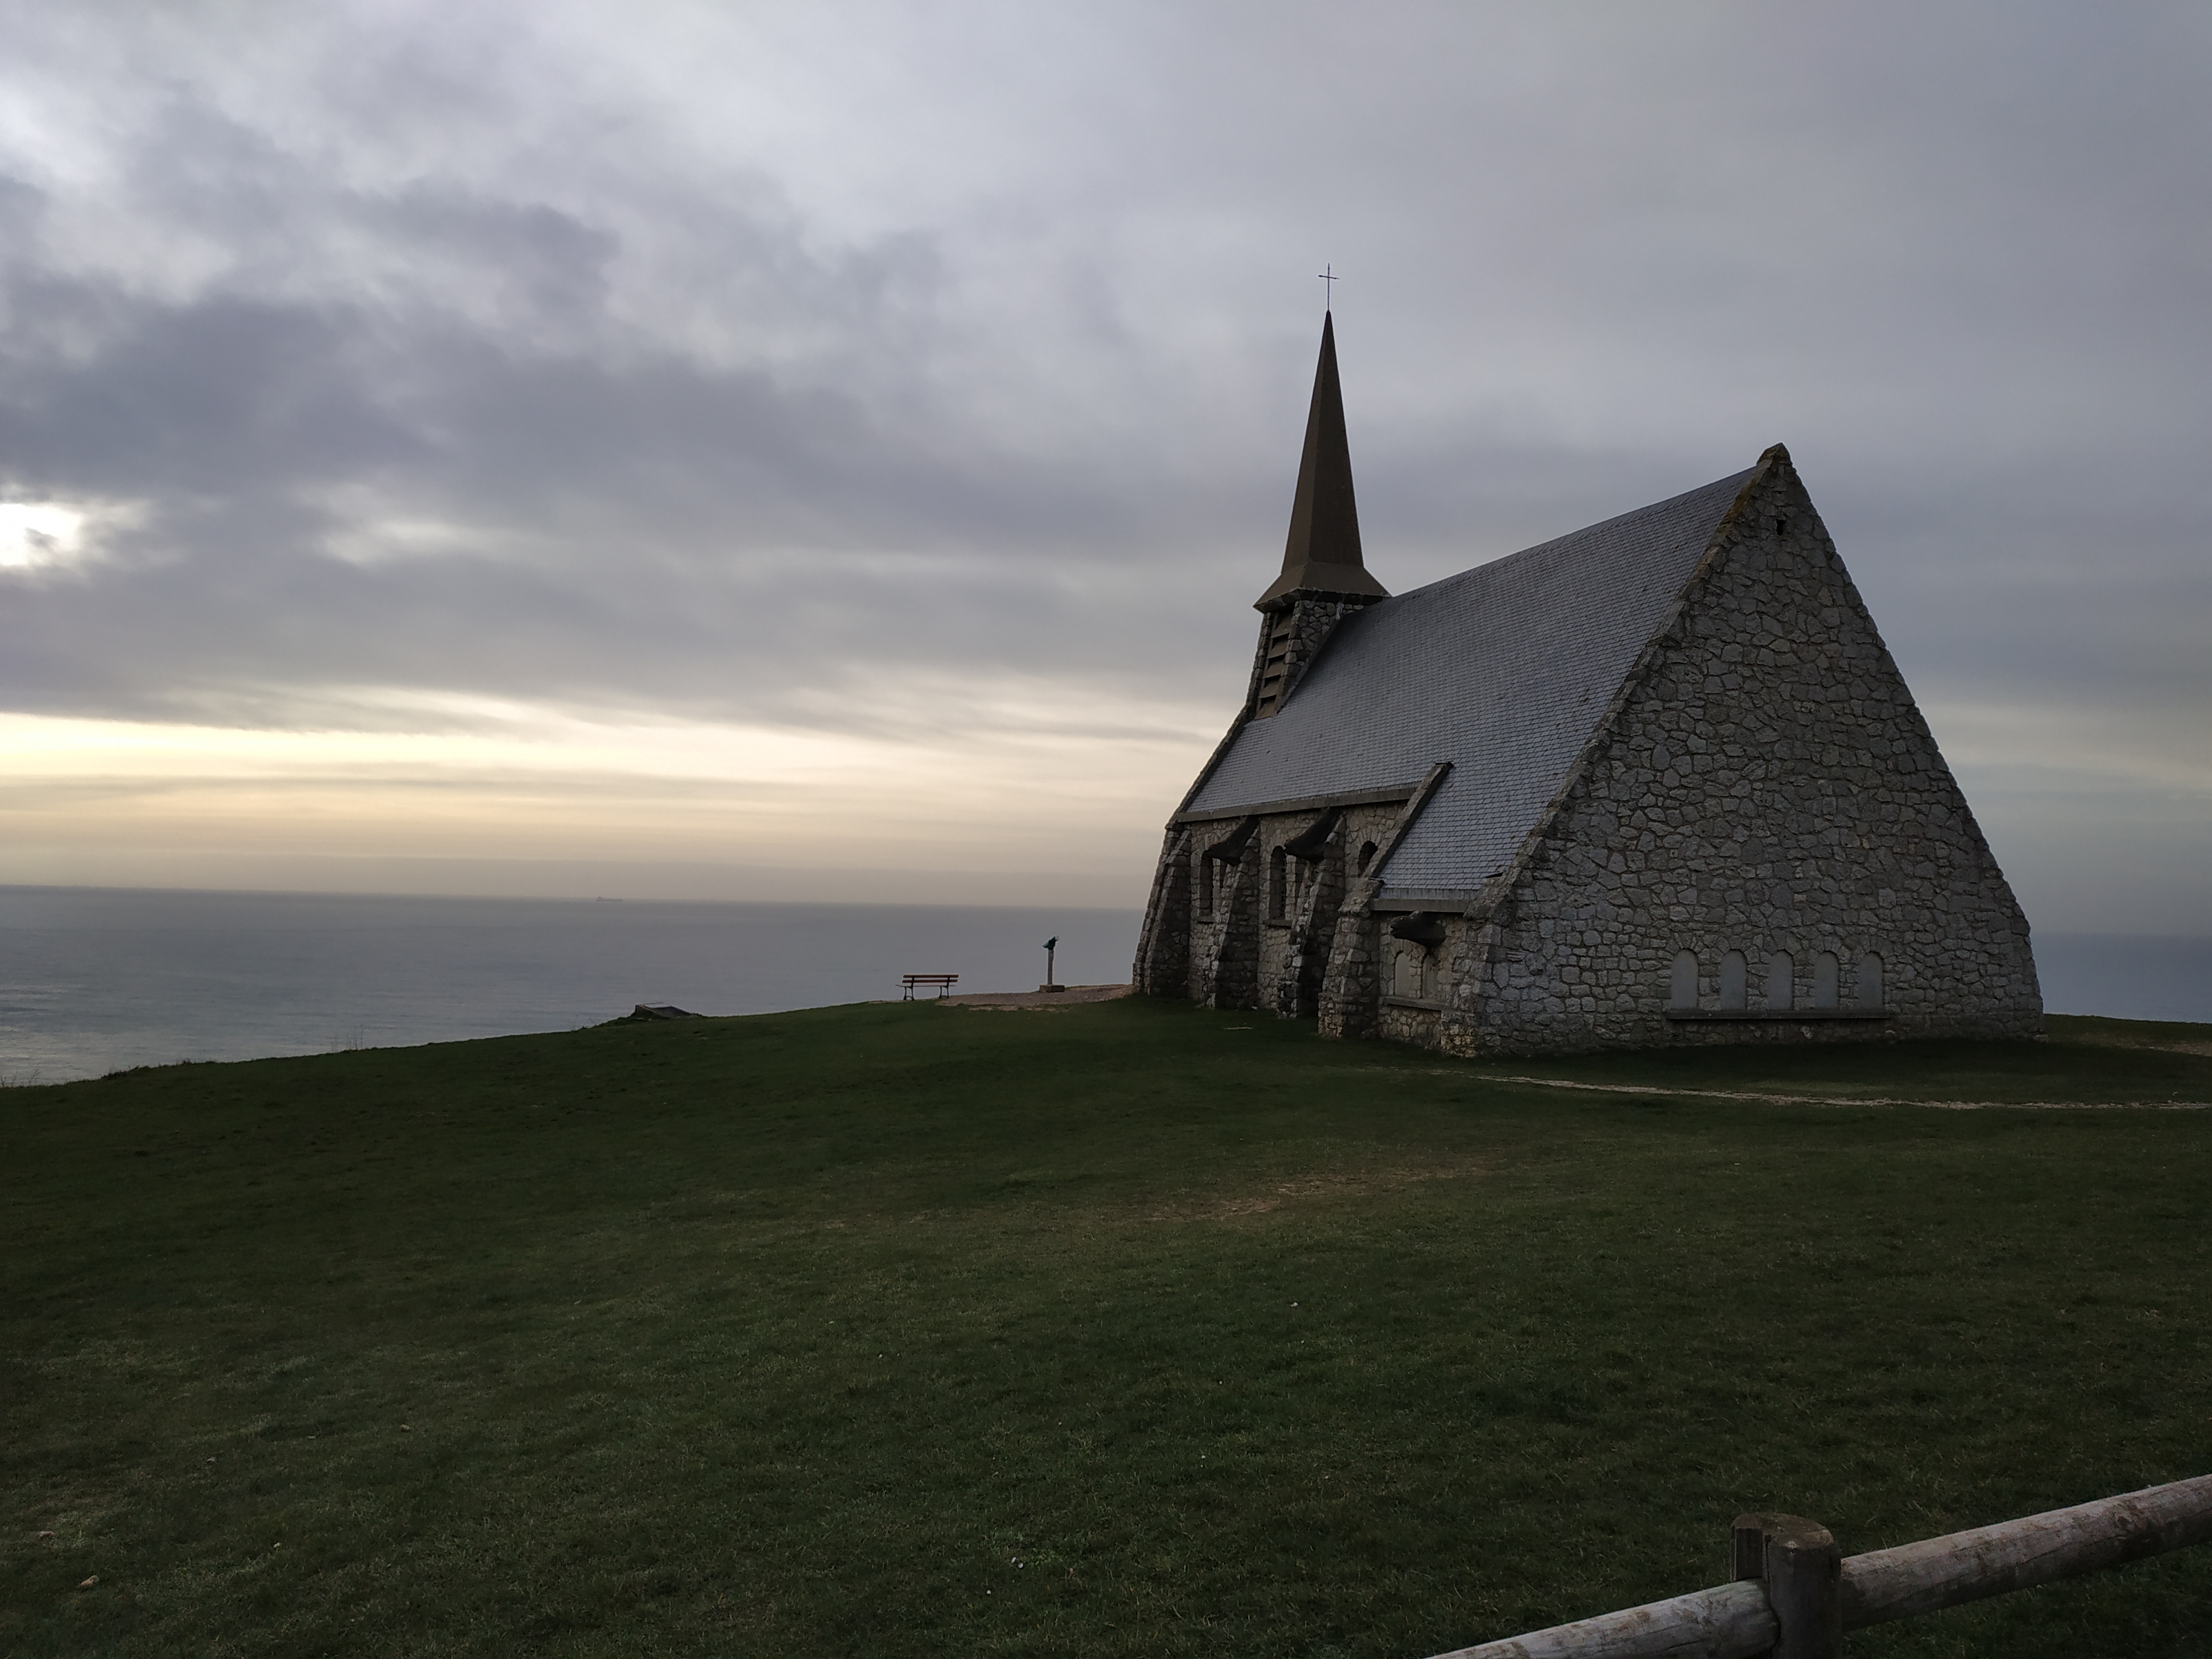
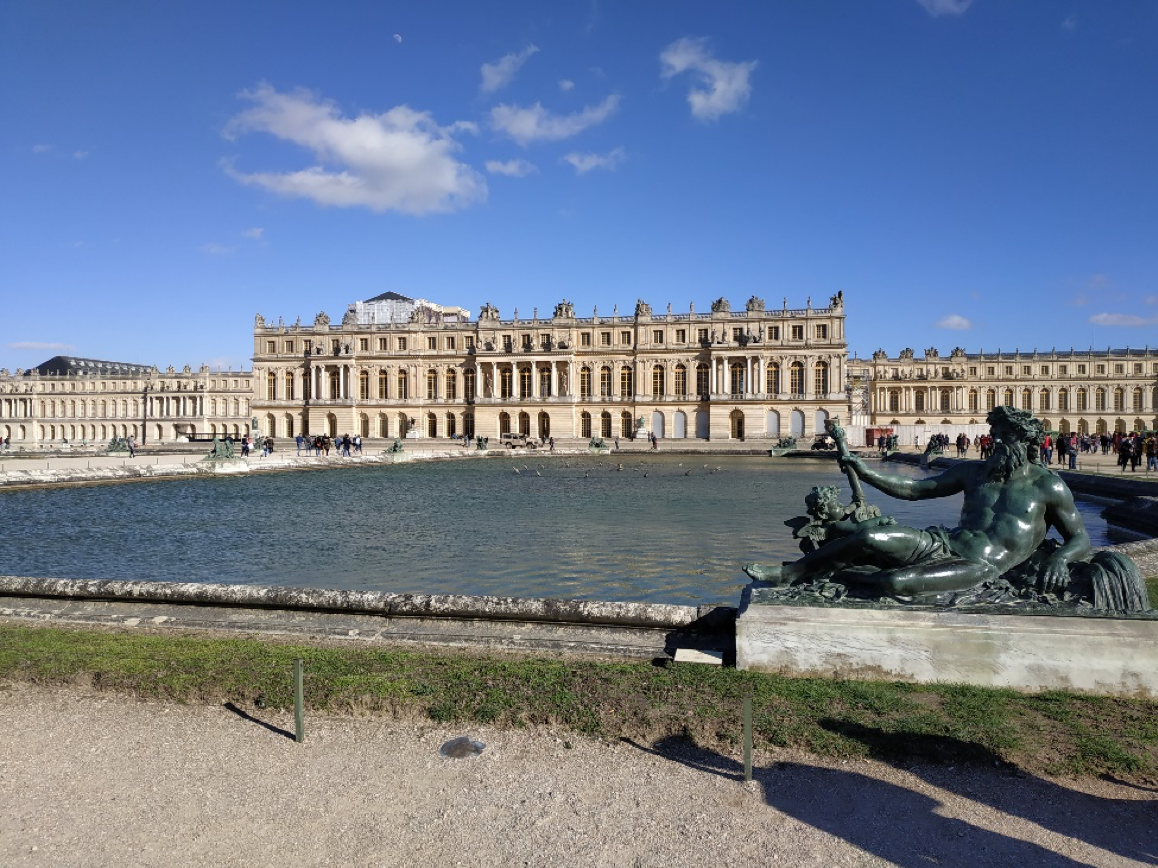
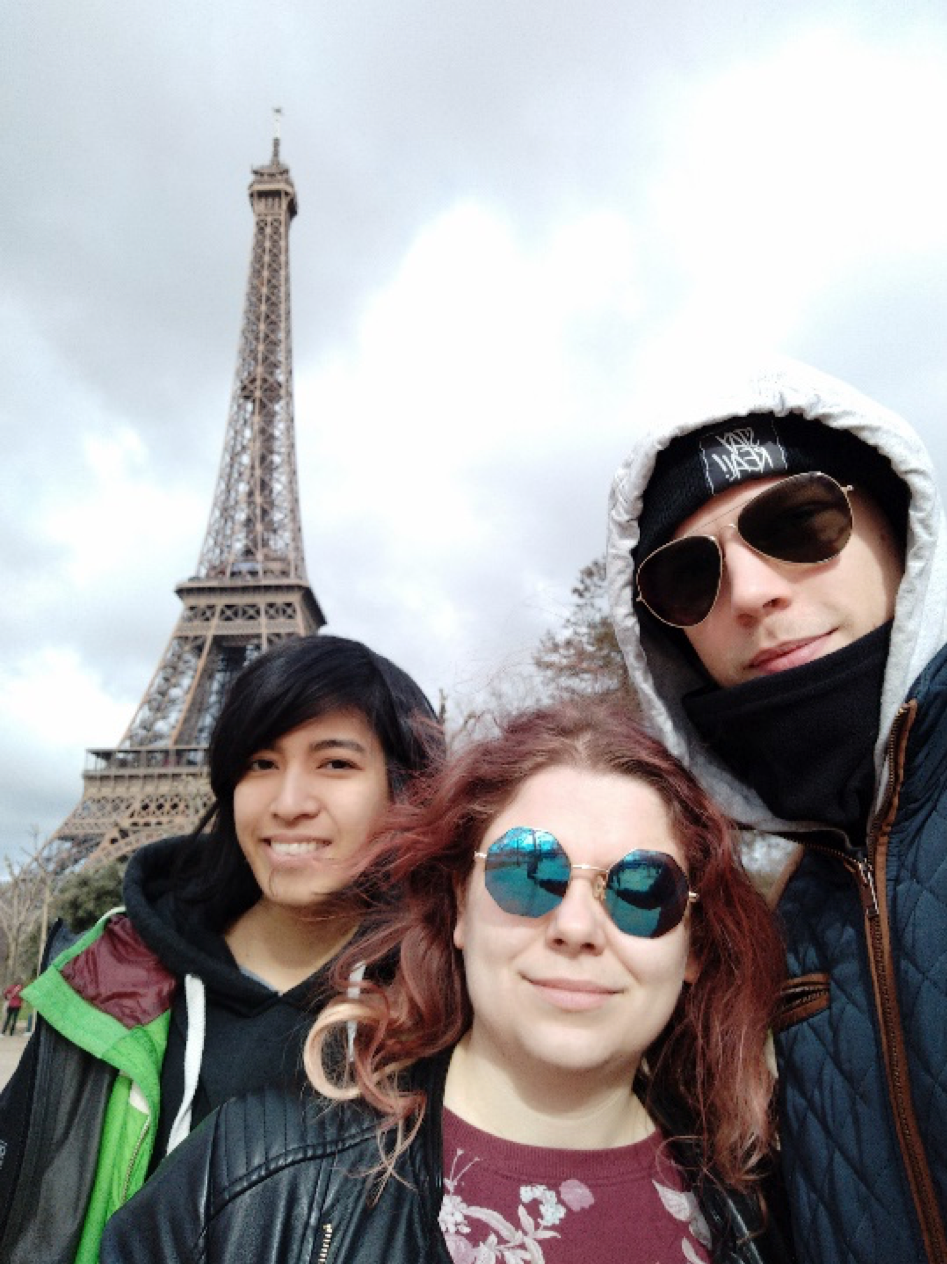
The next 2 days we spent at the landfill and at the natural gas station, respectively. During this time, we focused our efforts simultaneously on 2 goals: on the one hand, that of collecting isotopic data, and on the other, collecting data for the future work of modelling. We had to drive a bit further from Paris, but it was worth it. We collected weather data (with the 3D weather station) and methane data using Picarro and LGR. The first week was really intensive – a lot of driving and taking measurements. Then, on the weekend we made a trip to Normandy. It was some kind of small holiday, buuuuuuut we also took 1 instrument along to take some samples of the sea air – to measure it and for fun. We visited Rouen, Etretat and Le Havre. A really good time with cool people and amazing views (see below).
 |
 |
 |
 |
|
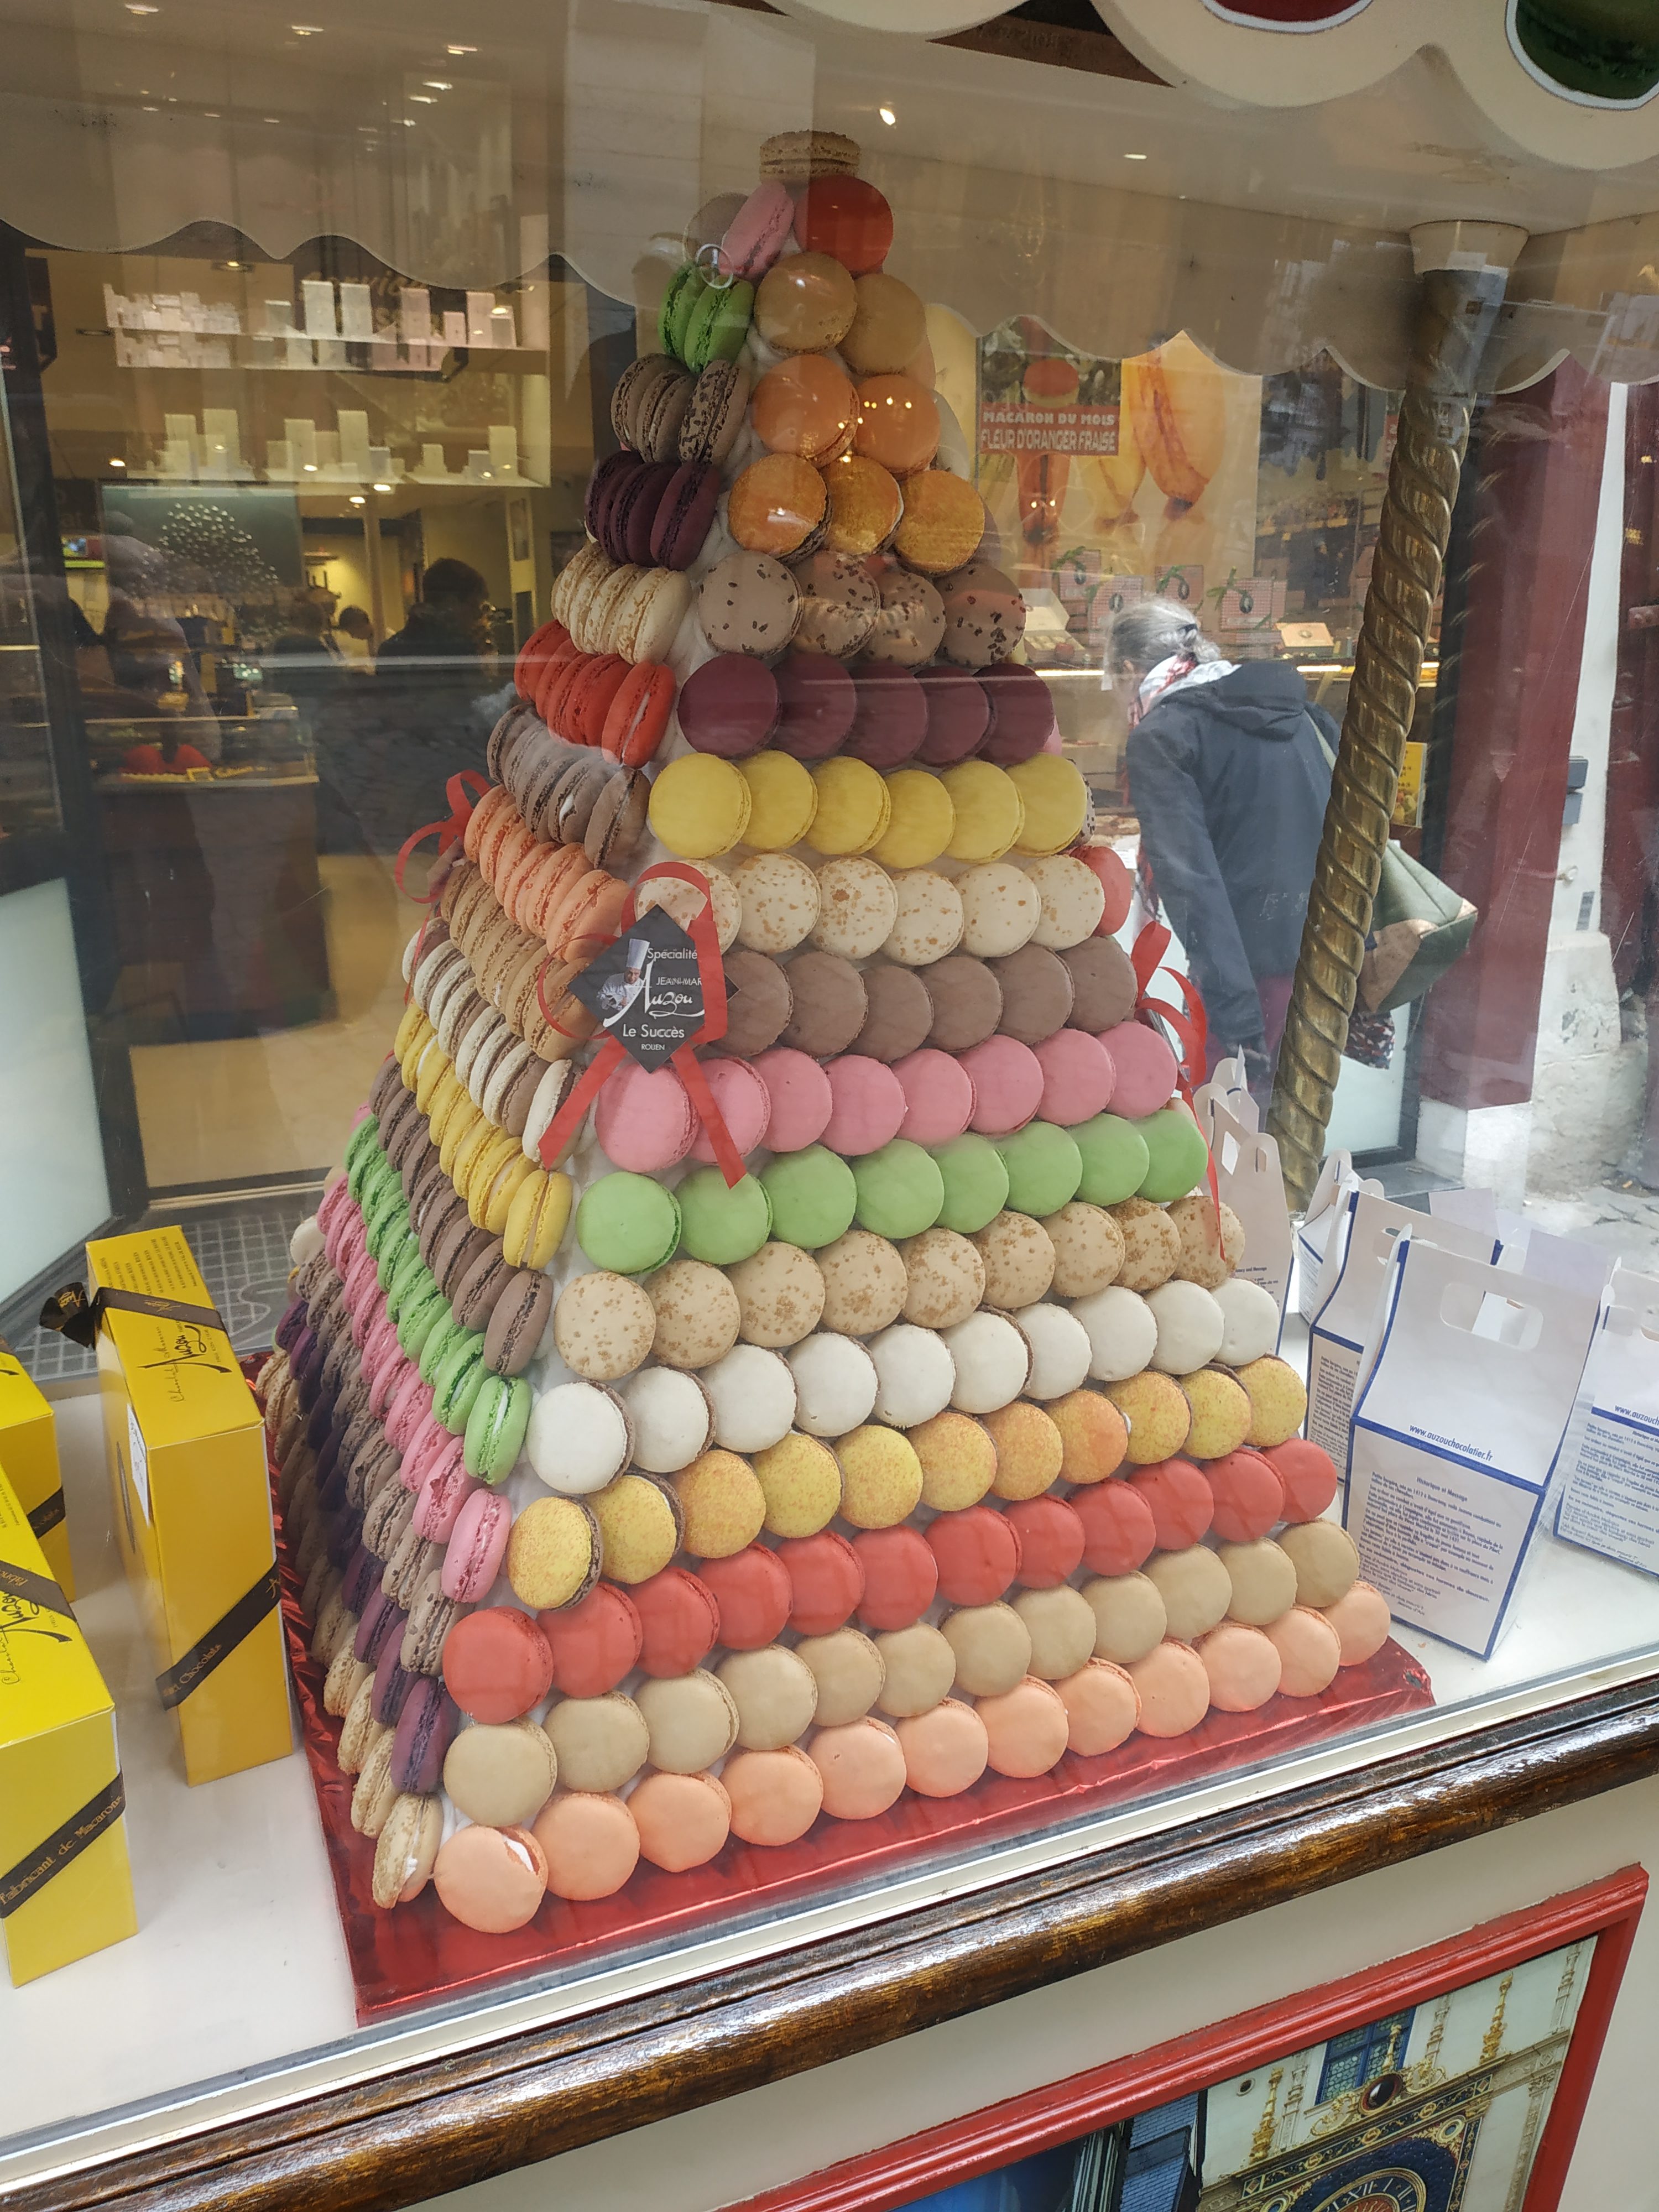
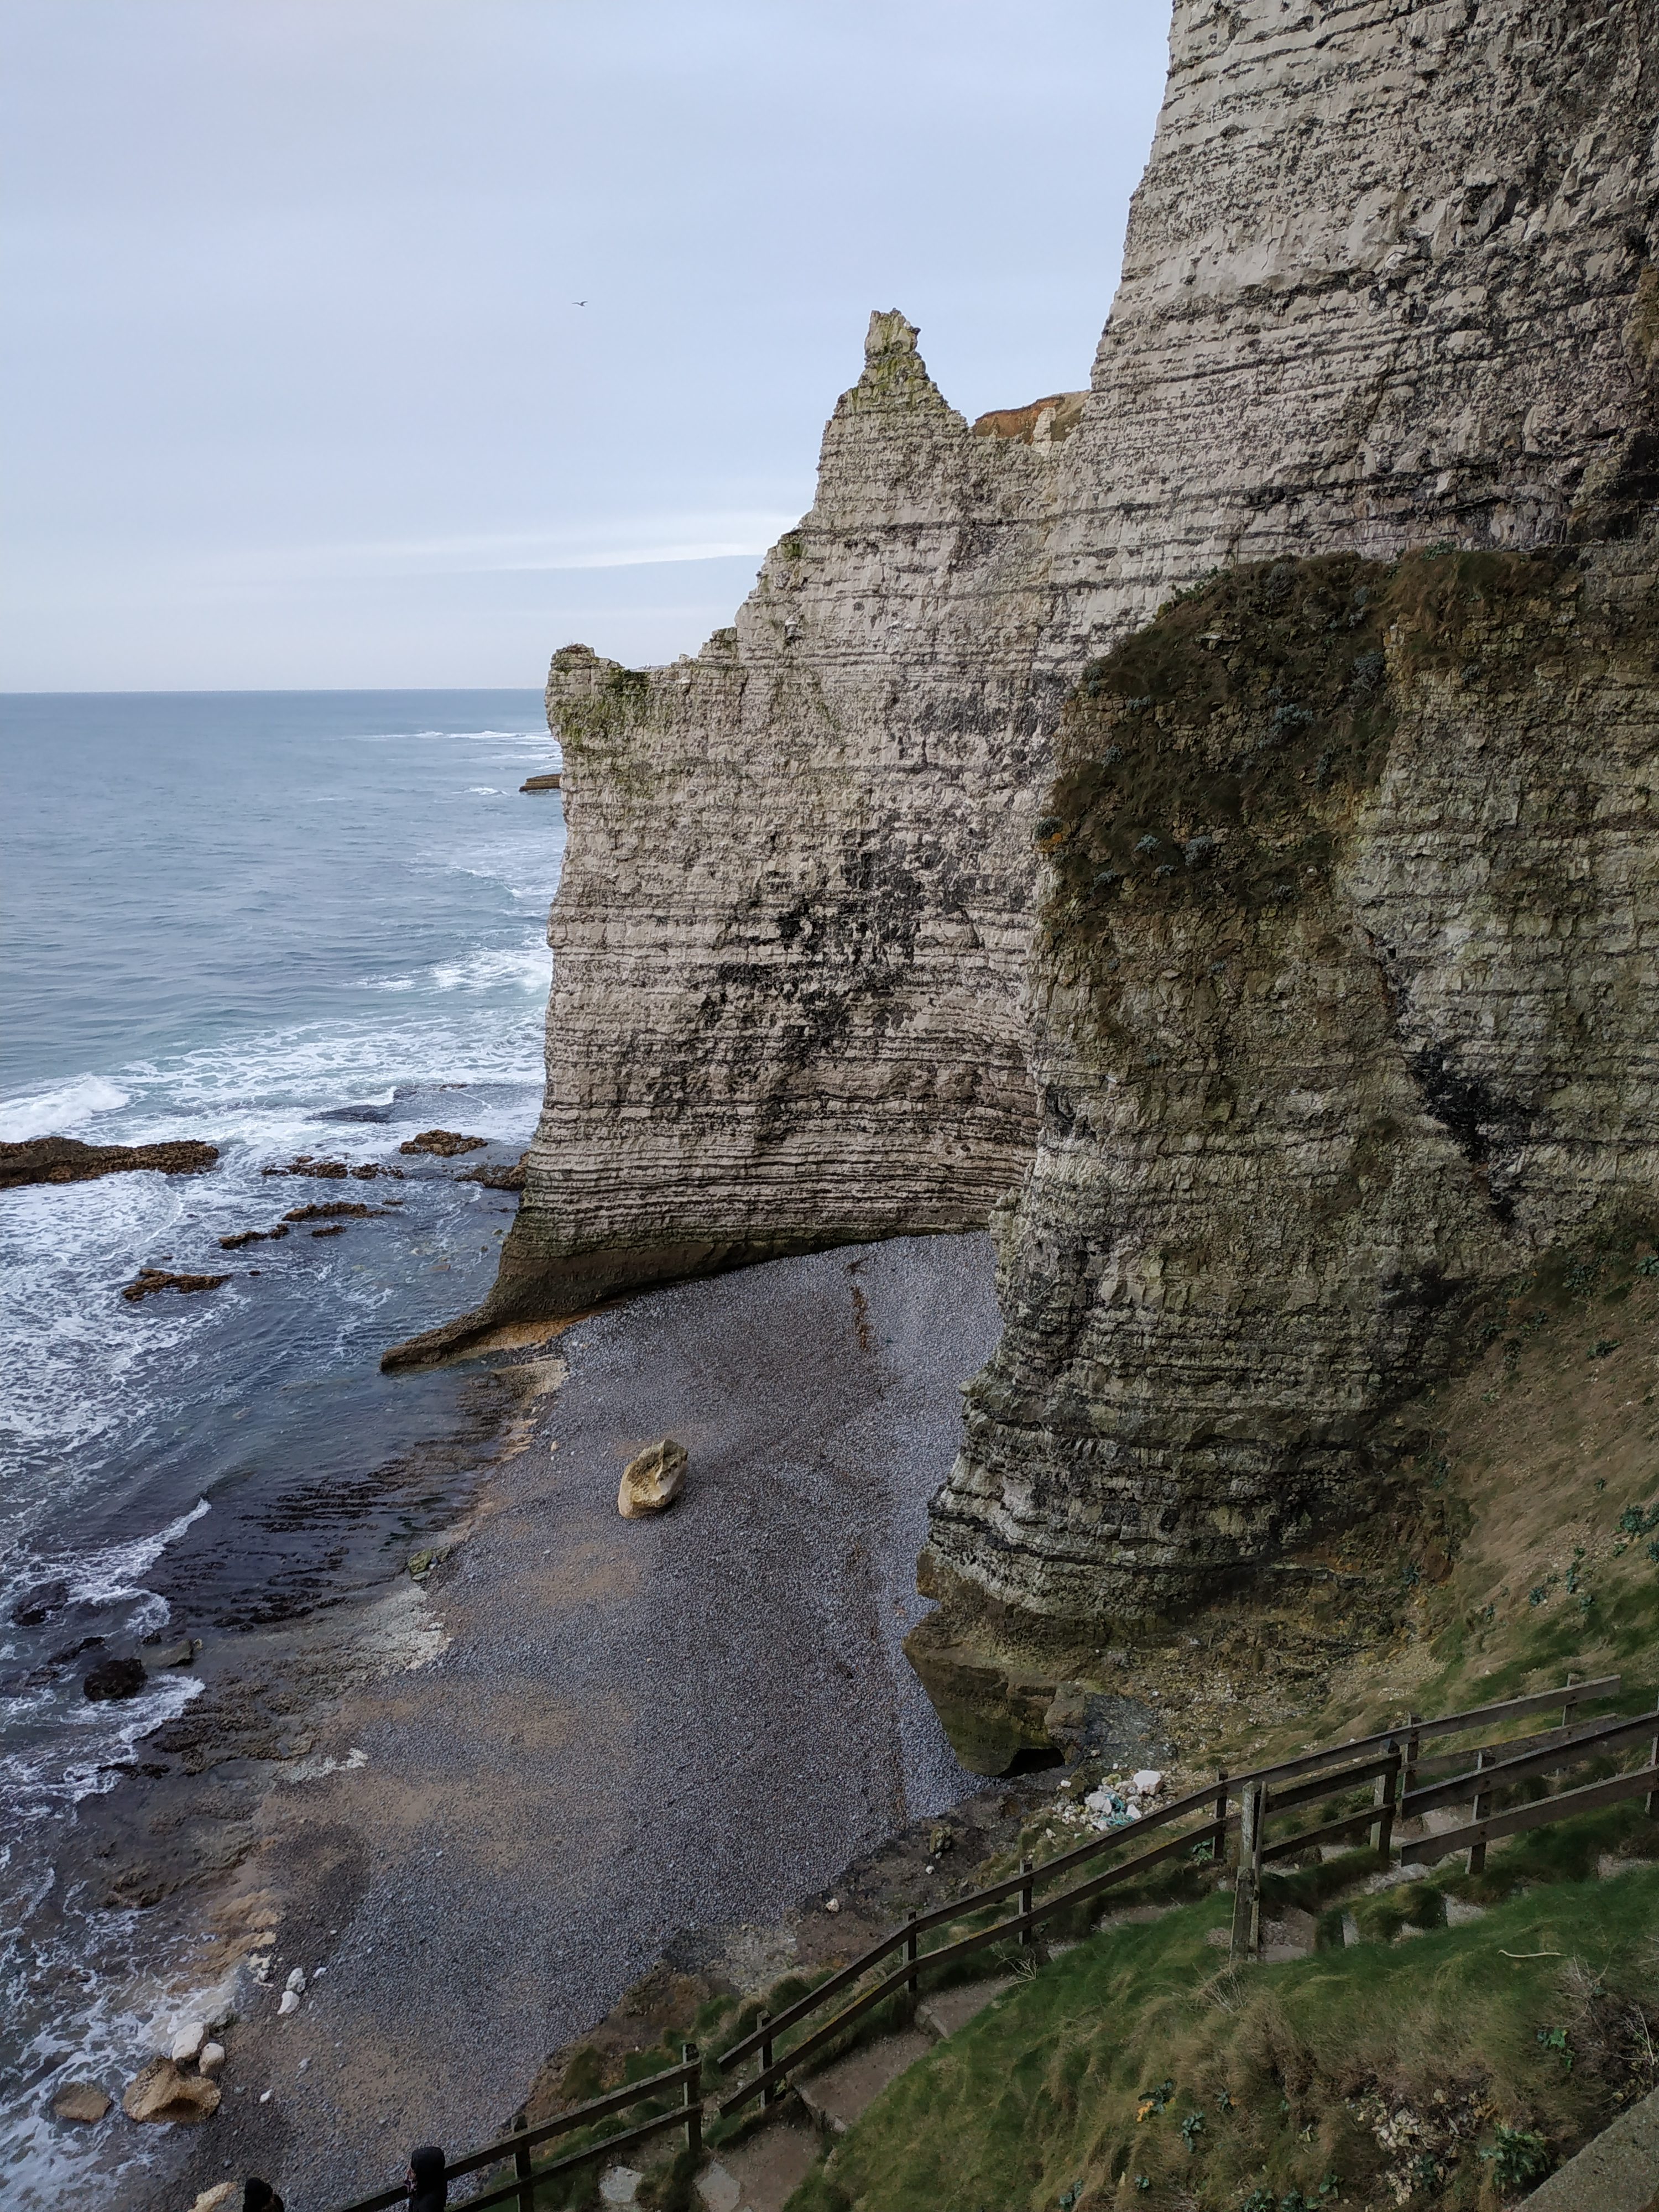
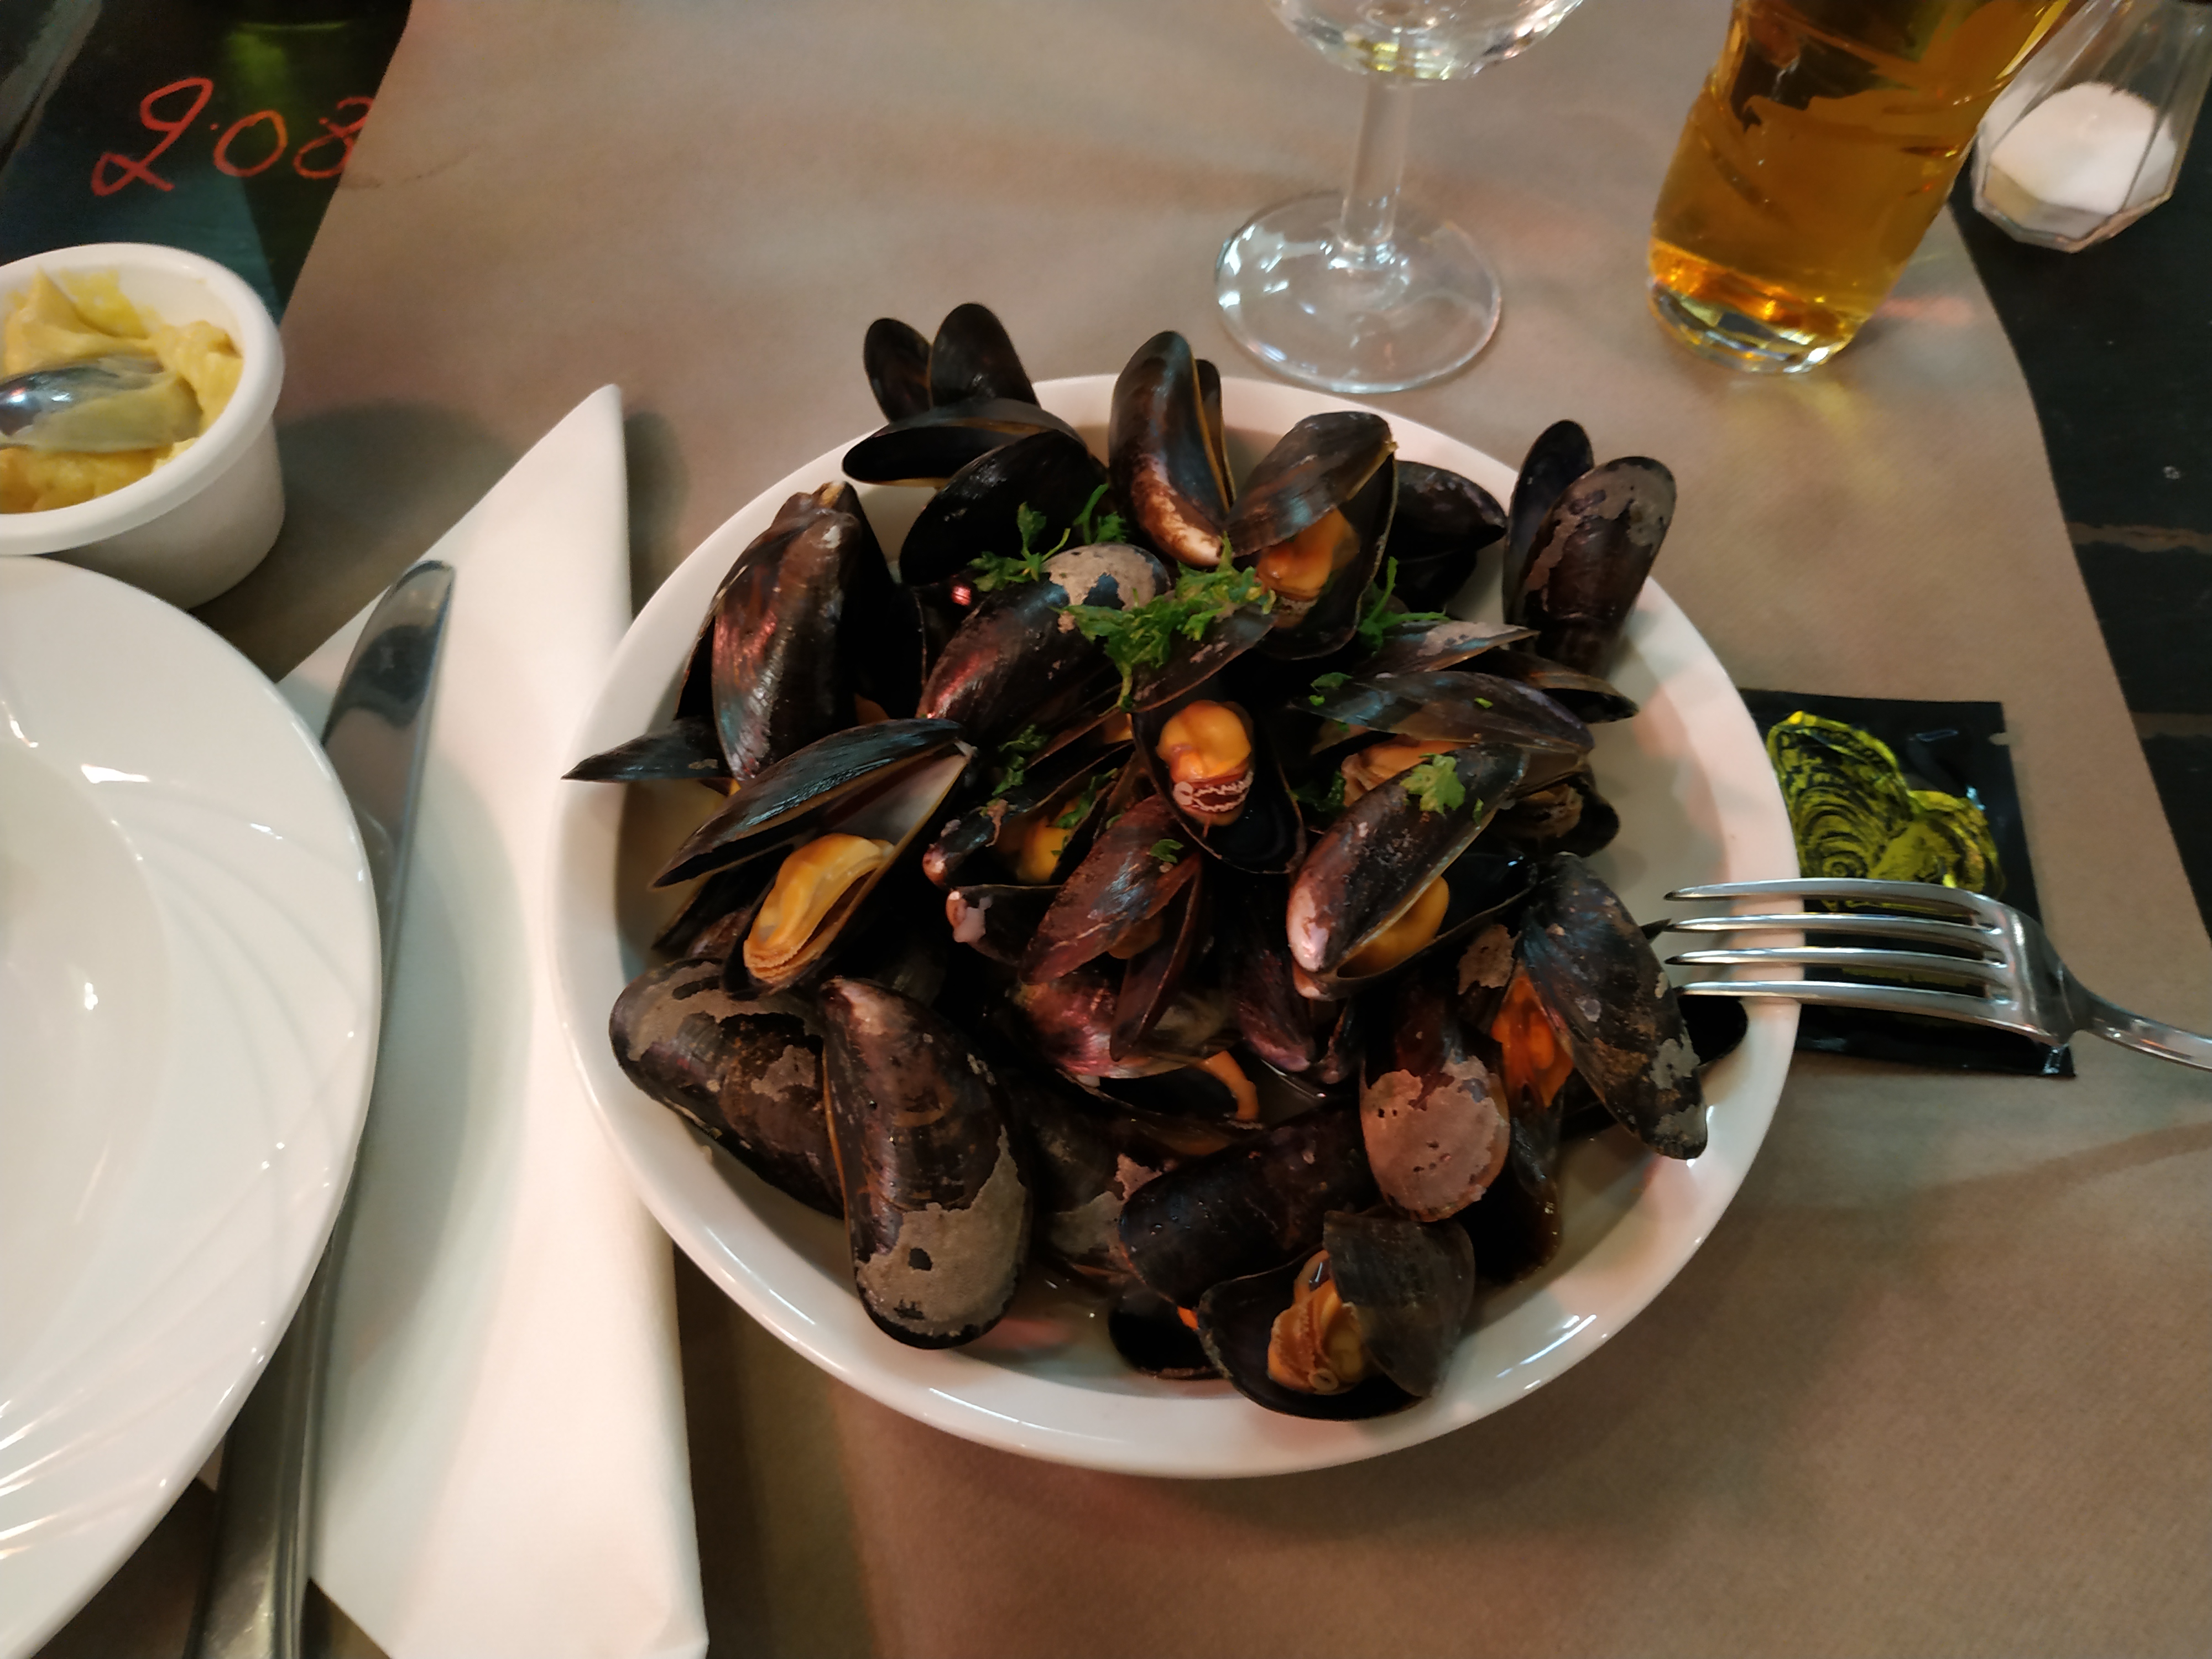
Fig. 3: Pictures of food in France and great views. Macaroons, mussels and the cliff in Etretat. |
|
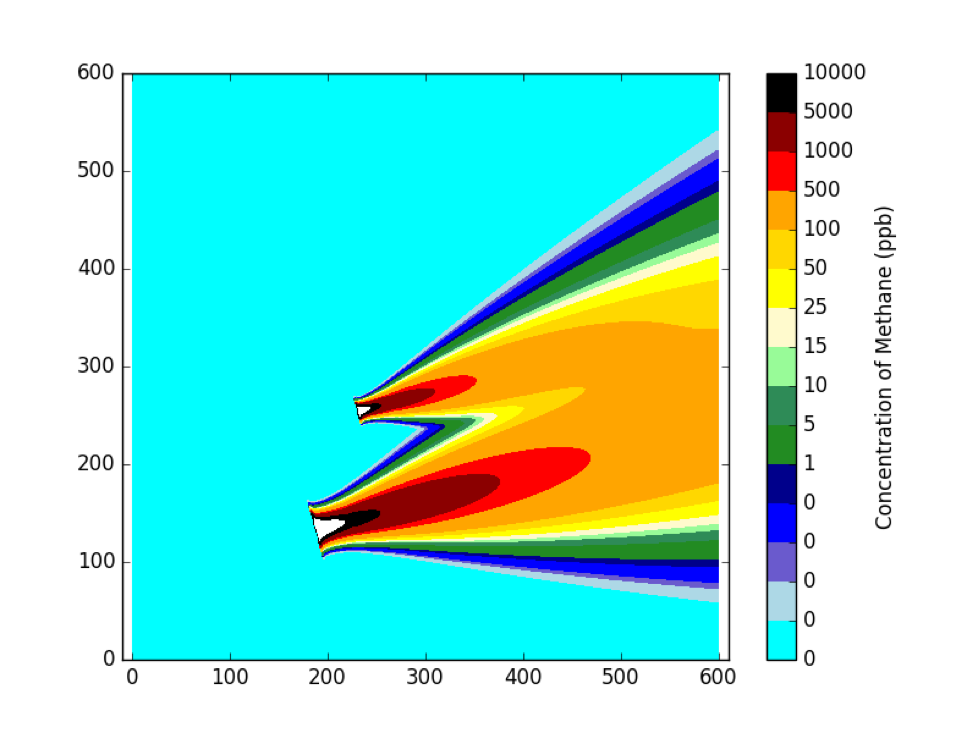
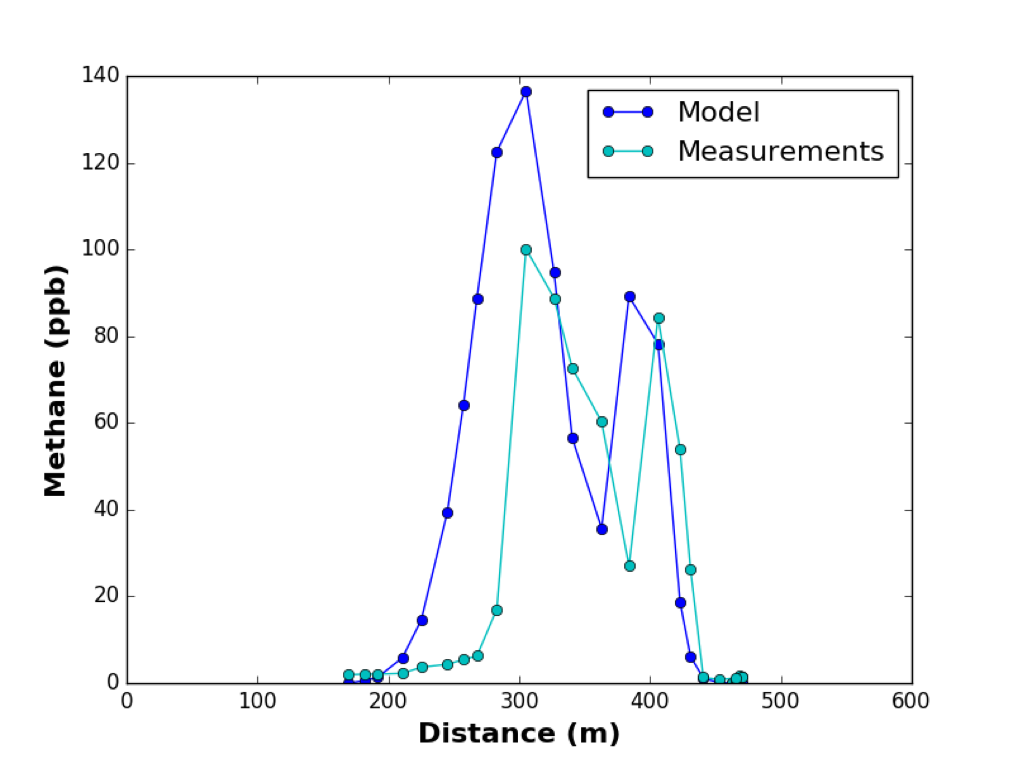
The following week, we took more measurements. This time directly in Paris. It was quite difficult to plan everything, but Sara did a great job. We drove through the city and tried to catch methane plumes. It was not so easy and we found just a few places with some small methane emissions. Two weeks of measurements were a first part of this secondment. The second part was modelling. The plan was to get some knowledge about the Polyphemus model (http://cerea.enpc.fr/polyphemus/). This model is a tool to estimate the methane emission from atmospheric parameters. And this time, Sara also gave us an introduction about it. She showed us how to prepare the input files, then how to run Polyphemus and how to analyse the output files. Some results of this nice work you can see below.
 |
 |
|
Pic 4. The graphs above show results of the Polyphemus simulation. I entered input data, such as wind speed, wind direction, temperature and stability class. Left:The shape of the plume from the natural gas station. Right:The comparison between the real measurements data and the results from the model. |
|
So after 4 weeks of work, I can try to answer the question first stated in the title above. The answer is: BOTH. In Paris you can find a lot of couples in restaurants, parks, museums or on the streets. You can also find places with methane emission. Usually, it is a small landfill inside the city, natural gas pipelines or urban sewage. In the city of Paris, there is not as much methane emitted as there is emitted from cow farms, from natural gas stations or from coal mines; however, it is still possible to measure it.
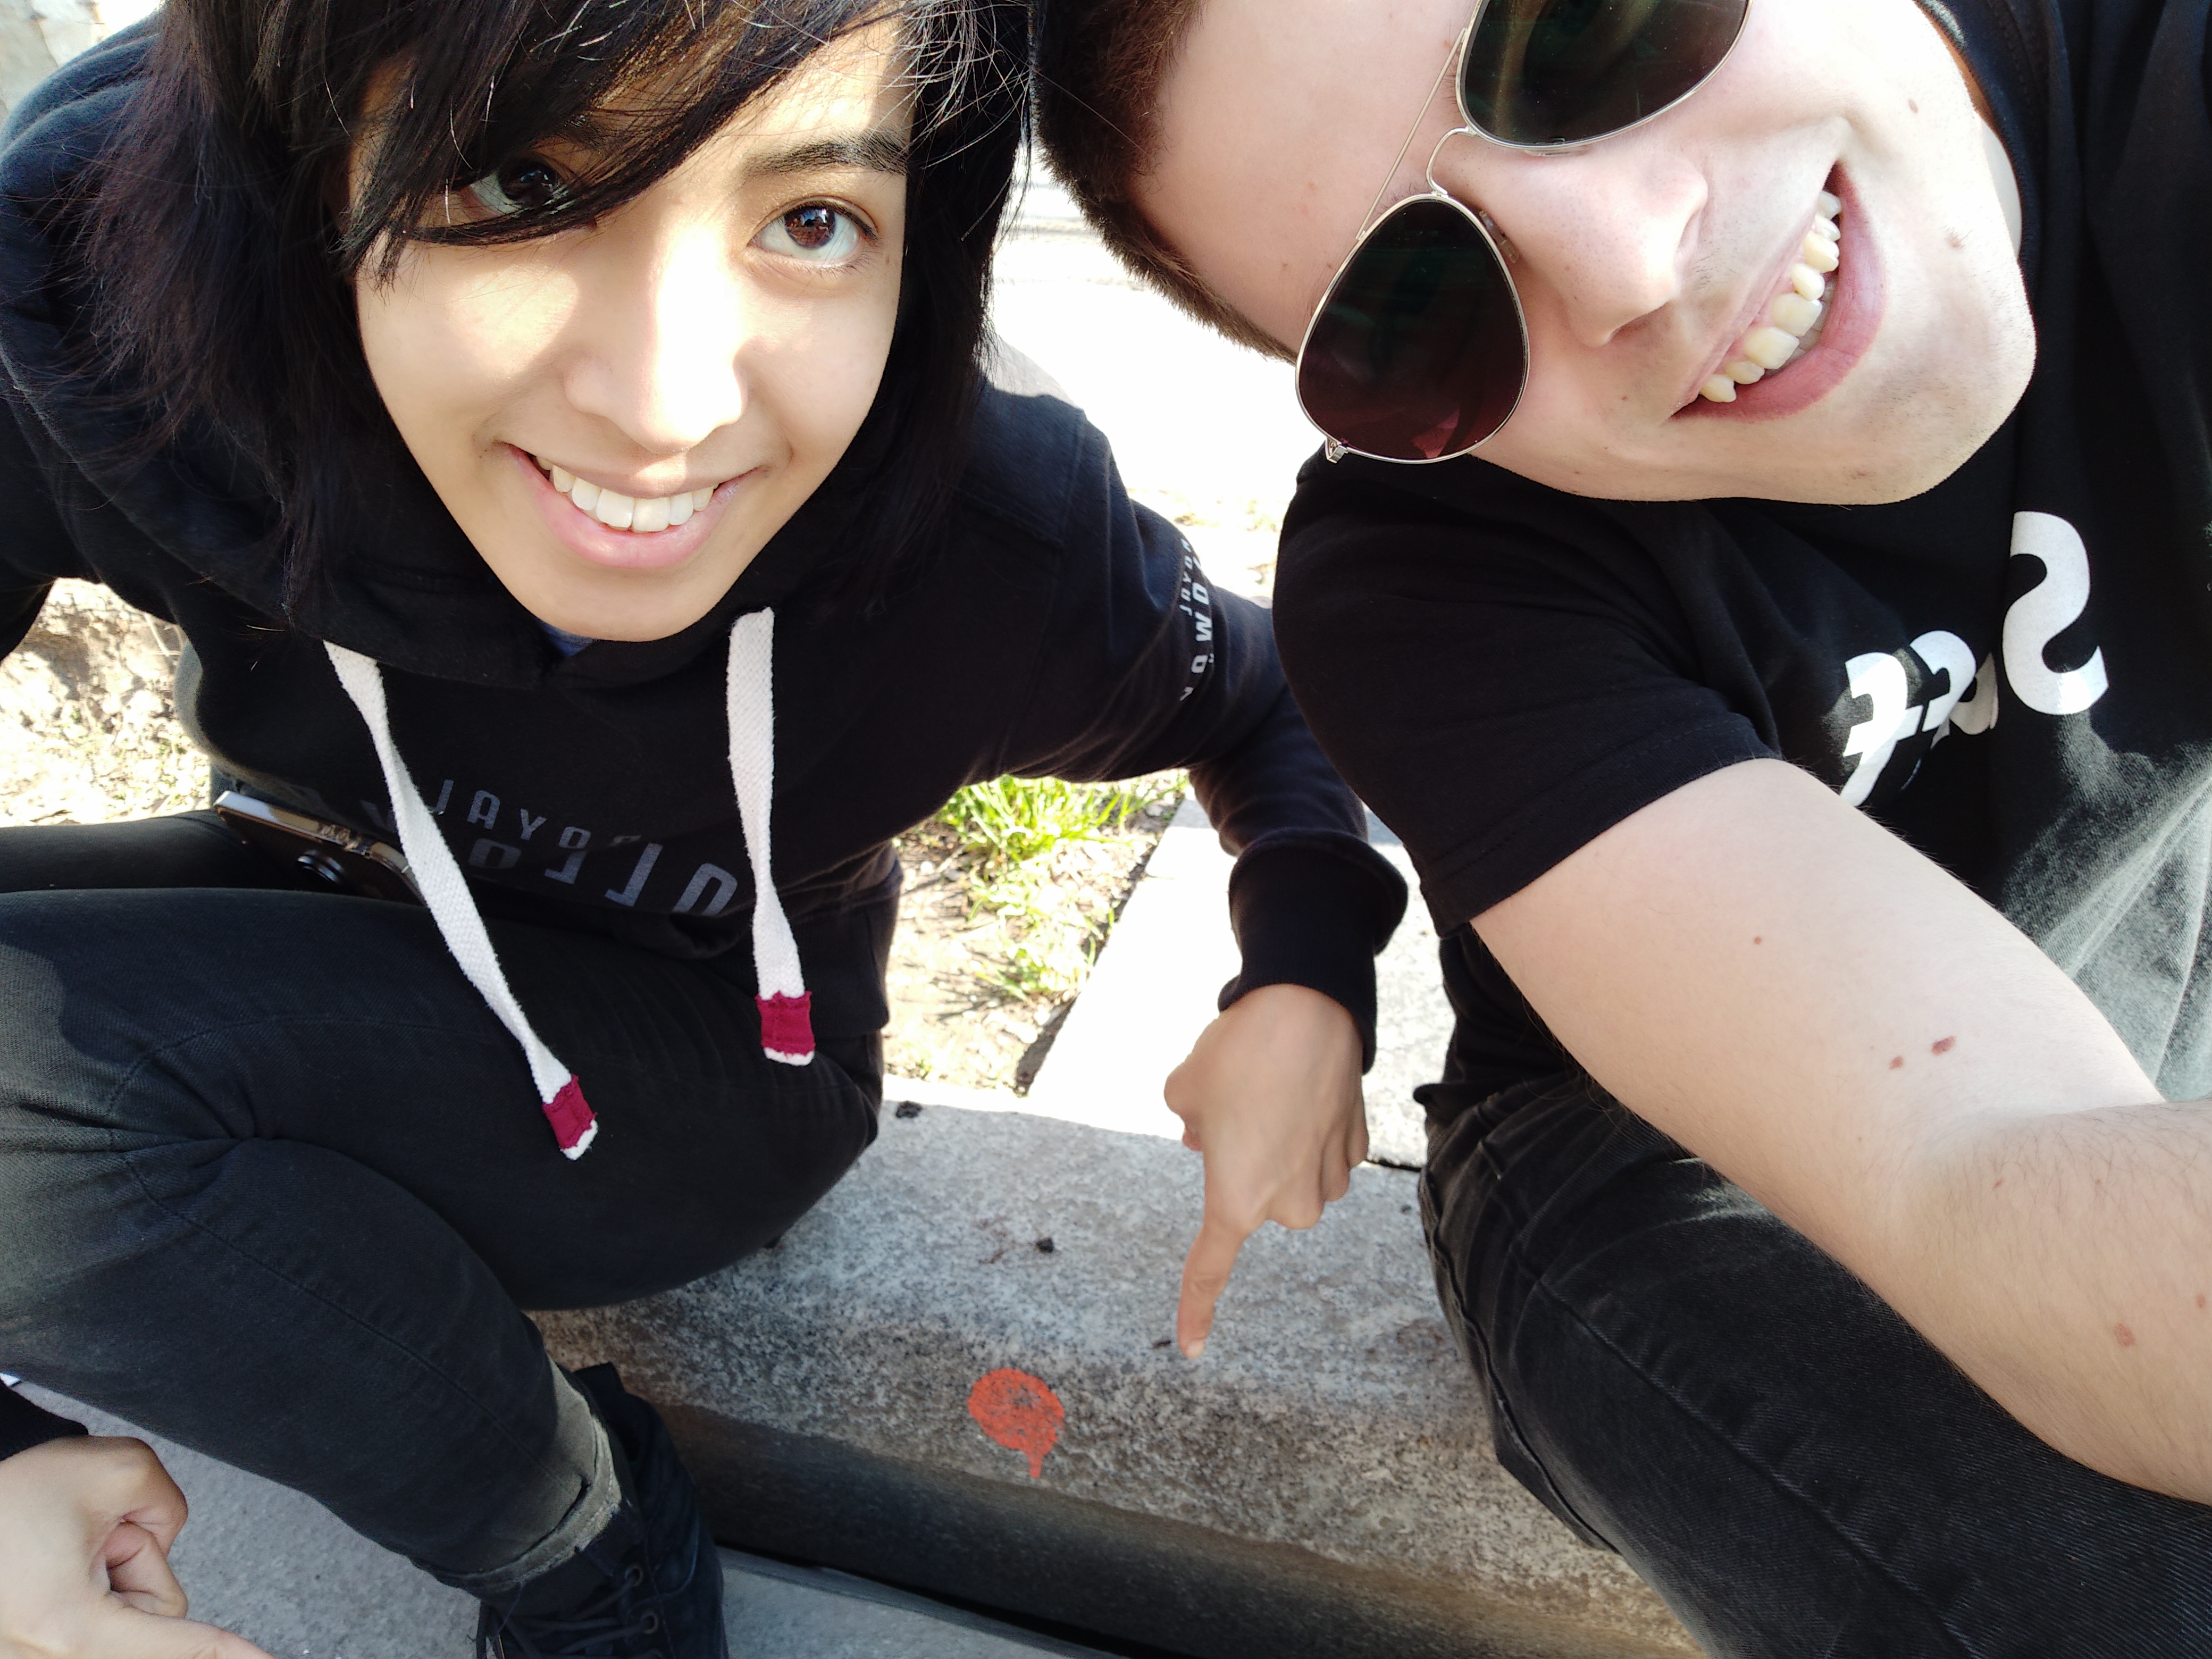
Some final impressions:
 |
 |
 |
 |
 |
 |