Blogs
Hossein Maazallahi – My collaboration with TNO
Fundamentally, I’ve been in contact with the Utrecht University (UU) and Netherlands Organisation for Applied Scientific Research (TNO) since the first interview before getting admission to the MEMO2when I was in Iran, and my supervisors were in Chile (Dr. Hugo Denier van der Gon; TNO) and the Netherlands (Prof. Thomas Röckmann; UU). Basically, I spend my working times at Atmospheric Physics and Chemistry Group (APCG), Institute for Marine and Atmospheric research (IMAU), and practically I also work with the Climate, Air and Sustainability (CAS) group which is in walking distance from IMAU.
Landfill Campaigns
Initially, I had some field measurements with TNO across close / open landfills in the Netherlands. The campaigns were held in fall 2017, when of course rainy days were not ideal time for holding campaigns especially across landfills (Fig. 1). During these campaigns we had Picarro Cavity Ring-Down Spectroscopy (CRDS), and two Tunable Diode Laser Spectroscopy (TDL) instruments. The instruments were installed in a small van. Functionally, all instruments were used to measure the atmospheric methane mole fraction, but depending on the precision, accessibility to the source, etc. each of the instruments might have their own benefits. Logistically, measuring across close landfills are easier but might be less exciting; however, it was interesting to measure on open landfills whilst trucks and employees were working on site.
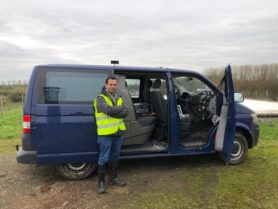 Figure 1 – Landfill campaign, NL |
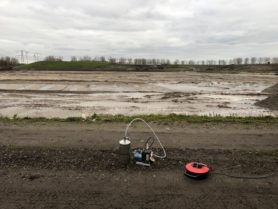 Figure 2 – Isotopic air sampling |
Taking samples for further isotopic lab measurements were also carried, where we got elevations in atmospheric methane concentration. In Fig. 2, the setup for taking air samples for further isotopic lab measurements is depicted. The first step of sampling is to find where to trap the air inside a bag, cylinder, etc. Normally, we read the atmospheric methane mole fraction using real-time instruments while driving around. Based on the methane excess, we pinpoint the possible interesting spots for taking samples and further identifying the methane emission sources.
TNO/NOGEPA Cruise
It is not always about measuring onshore, let’s go offshore and see how much methane gets emitted from oil and gas platforms. In July 2018, along with colleague from TNO, ECN, and Netherlands Oil and Gas Exploration and Production Association (NOGEPA), we departed from Den Helder for a three-day offshore campaign to get a better understanding of methane emissions from oil/gas platform in the North Sea. The instruments we had were from Picarro (G2301, and G3402) and Aerodyne. We had inlets for the instruments from different heights. The sea was in a relaxing mode during this campaign, and the sun was very joyful, and of course the seagulls were around. During this cruise the originally support vessel was fully equipped with methane detectors from deck to the bridge. We had Aerodyne instruments plus Picarro G4302 inside the trailer (Fig. 4).
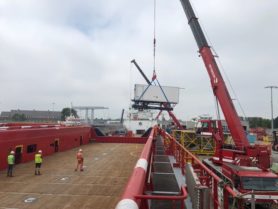
Figure 3 – Lifting the lab container to the ship
Th Picarro G2301 was nested in the bridge, and based on the reading, the isotopic samples were taken in small aluminum bag for further lab analysis. The sun was in a very shining status, we had N2O release test from platforms (Fig. 5). Not all of the platforms were in production phase, some were producing either oil or gas or both. We also had to consider the safety sailing buffer zone, but once we had the elevation downwind the platform, we were performing zigzag sailing to receive a better picture of the plume based on different distances from target platform.
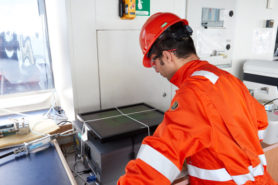 Figure 4 – Picarro G2301 inside the bridge |
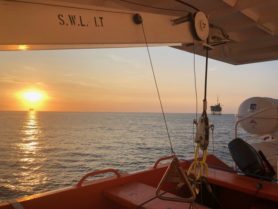 Figure 5 – Sunset view from the mobile measurements vessel along with some platforms |
I had a very joyful conversation with the colleague from TNO, NOGEPA, the crew member (Fig. 6). The campaign followed by another cruise in November will lead to an evaluation method on how to estimate methane emission from oil/gas platforms in a better precision. I had an interview related to this cruise which can be found on youtube.
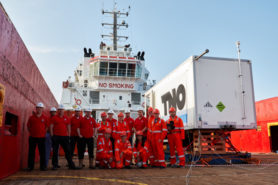
Figure 6 – The TNO/NOGEPA cruise team
TNO/UU Limburg
In fall 2018, we had some measurements in historical coal mining area in south the Netherlands. In this campaign I was involved in the mobile measurements part with the small van and Picarro G2301 on-board. This campaign is important as there might be a risk of explosion within the residential area. Accidentally, once we were carrying out mobile measurements, we observed an elevation, so we put our effort to find the potential leakage spot. After couple of visits on some streets in a same neighborhood, we notice some employees from local gas company. After having a conversation with them, we noticed they also got a report over a leakage at the same spot (Fig. 7).
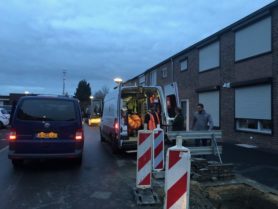
Figure 7 – Natural gas distribution leakage spot
Internally, I have enjoyed the atmosphere of both groups at UU and TNO while externally I have enjoyed all the discussions, chats, coffee breaks, groups meetings, communications etc. Planningly, data evaluation over the recent measurements and further projects is in the progress and we have more projects to come for future work in collaboration with colleagues from TNO.