Blogs
Malika Menoud – Secondment at Royal Holloway University of London
Let’s start! – June 18th
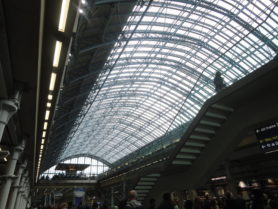
I’ve arrived safe at King’s cross train station. It still takes more that 1 hour to reach Egham, where are the University campus and the house I’ll stay in. The secondment will be of 4 weeks. |
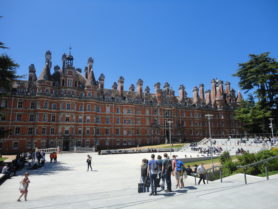
RHUL campus. This bright orange brick building is the founder’s building. It was built by M. Holloway when the college first opened, in 1879, originally only for women. |
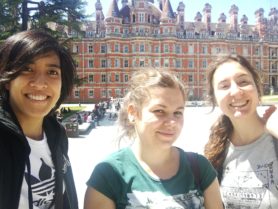
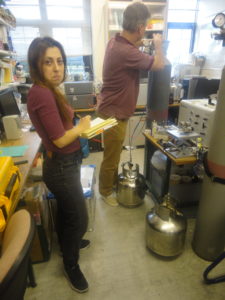
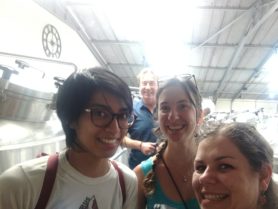
I’m not the only MEMO2 student visiting this month. Sara Defratyka (middle on the picture), a PhD at LSCE in Paris (ESR 5) will also be doing her secondment at RHUL at the same time. We were welcomed by Julianne Fernandez (left on the picture), as we’re staying in the same house in Egham. We’re also working with the other MEMO2 PhD at RHUL, Semra Bakkaloglu, their professor Dave Lowry, associate professor Rebecca Fisher and research assistant Mathias Lanoisellé (Picture: Sara D.). |
At the lab, part 1
|
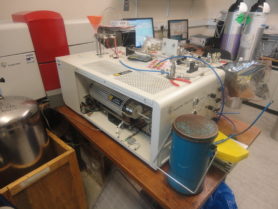
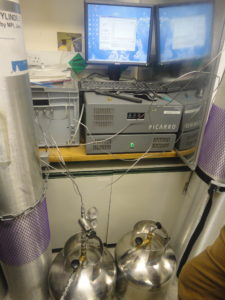
Here we can see the extraction system of the trace gas analyser from behind. The combustion oven sits inside (horizontal cylindric shape). After loading the appropriate volume from the samples bags / flask, most of the following steps happen in this metal frame. |
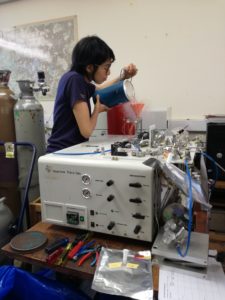
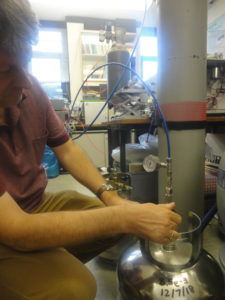
Below the orange fennel is another dewar where the traps are submerged. It needs to be filled every two hours while measuring, to keep the temperature of the traps low enough to have a good extraction. Here, Julianne is doing it (pic: Sara). |
Sara came to RHUL with the instrument she uses in her PhD, which is an isotopic Picarro mobile analyser. We’ve put it in the lab on top of the mobile instrument the RHUL team is using for measurement campaigns. We’ll go for measurements campaigns, as it is the purpose of Sara’s secondment, and also part of my objectives here. Having Sara’s isotopic Picarro was also very helpful to try out different dilutions and mixtures for making calibration gas. Indeed, the RHUL lab, together with UU will need to provide cylinders for the calibration of the isotopic Picarro of the other MEMO2 students. We require for this to find methane sources both depleted and enriched in 13C, that we will dilute in the cylinders to obtain two different concentrations for each (pic: Sara). |
At the BGS – June 21st
|
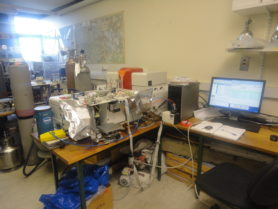 The measurement system we see is the ‘trace gas analyser’, which is used to extract methane from sampled air before measuring its isotopic value on a mass spec. The isotopic ratio that is measured here is 13C/12C, which can be used to identify the origin of the methane. Isolating methane from the air, where it is present at concentrations as low as 2 ppm (0.0002 %), is done by freezing it at a temperature lower than -130 ºC. It is then concentrated and converted into CO2 by combustion, before being sent to the mass spectrometer which will separate the different masses (12CO2 and 13CO2) to quantify them. We also use a similar system in our lab at Utrecht, with which we also measure 2H/1H in methane. You can learn more about our measurement system in my previous portfolio, where I’m telling about how we set it up for ambient air measurements in Krakow.
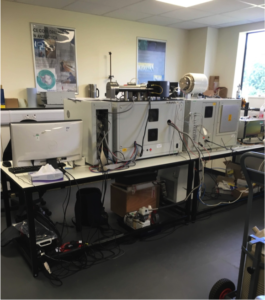 A few days after I arrived, we went to visit the British Geological Survey. In one of their labs, they are setting up an extraction system to measure hydrogen isotopic signature (2H). We had an appointment there to give flasks measured at UU, so that they can wedge their scale (pic: Juli).
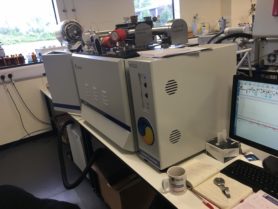
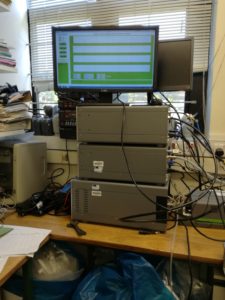
They are now in the final stage of optimizing the parameters for the measurements to be stable. The system takes now a lot of space and will eventually be reduced later. It is using an automated inlet for samples in 250 ml glass bottles, and can fit 15 at a time. |
||||||||||||||||||||||||||||||||||||||||
First, second and third campaigns (June 22nd, 26th and 27th) |
||||||||||||||||||||||||||||||||||||||||
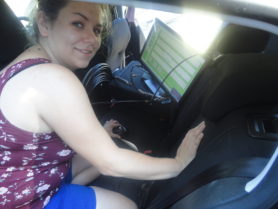
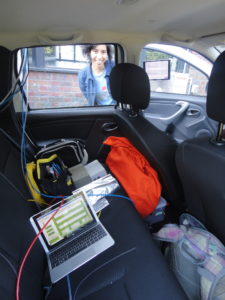
Some preparation is needed before going to the field. In the morning we bring the instruments from the lab to install them in the cars. We can see Sara is happy because her Picarro is working, and she’ll get to try the air core she’s built. The goal is to obtain CH4 concentration peaks with a better time resolution, and therefore more data points of its isotopic signature. |
||||||||||||||||||||||||||||||||||||||||
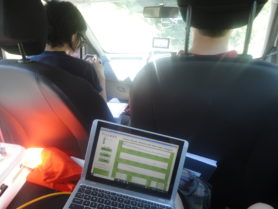
In the other car, where I’m sitting, there are two instruments from RHUL: a Picarro and a LGR analyser. The first is measuring methane mixing ratios accurately, and the second is measuring ethane together with methane. The data from the LGR cannot be used for knowing CH4 concentrations precisely, but is used by Julianne for calculation of the ethane / methane ratio. |
||||||||||||||||||||||||||||||||||||||||
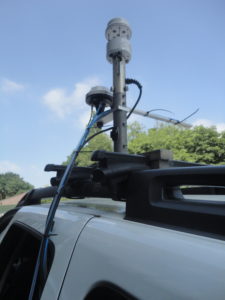
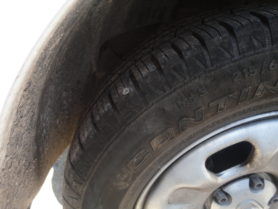
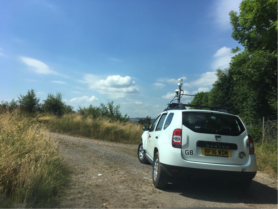
The air is directly pumped from this inlet, fixed on the roof top of the car. It also has an anemometer and a GPS receptor. An additional tube is also added for getting samples. |
||||||||||||||||||||||||||||||||||||||||
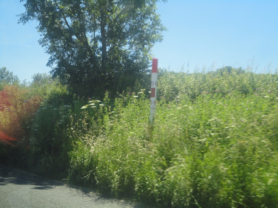
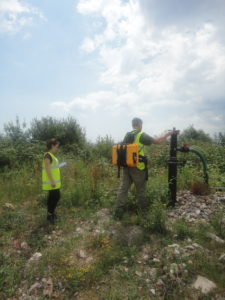
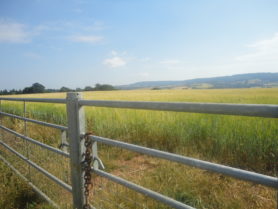
The markers for the presence of a gas pipeline in the UK look like this. They can indicate potential methane emission sources. Here is one we saw in Oxfordshire, where we went for the second campaign. |
||||||||||||||||||||||||||||||||||||||||

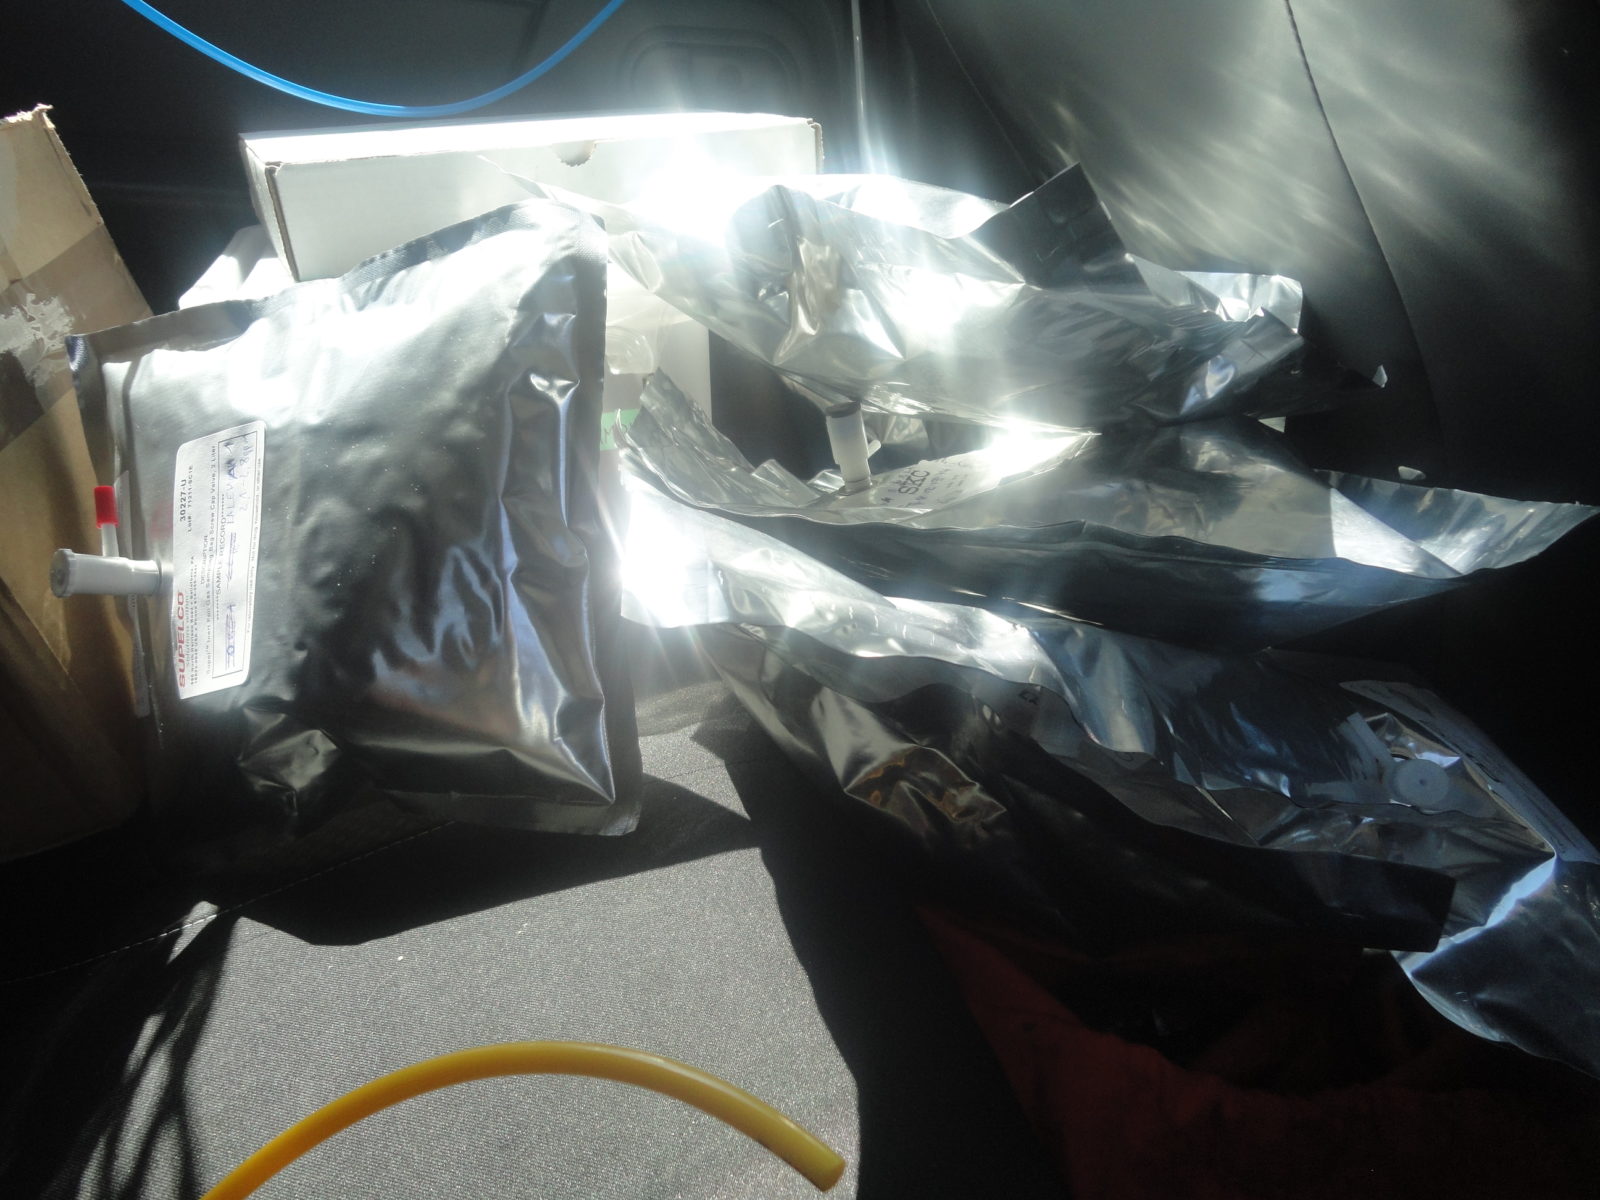
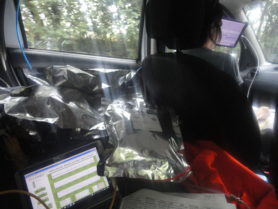
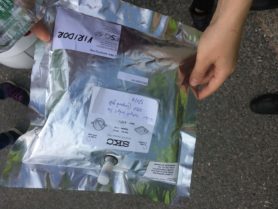
There are already some shiny samples piling up in the car next to me. They are filled by direct pumping in the bags from one of the roof’s line. To take a sample, we need to stop by the side of the road at the location where we see a higher CH4 concentration on the Picarro and LGR. The samples are stored in aluminum bags and will be measured later on the IRMS for the isotopic signature of methane. |
||||||||||||||||||||||||||||||||||||||||
Fourth campaign – June 28th |
||||||||||||||||||||||||||||||||||||||||
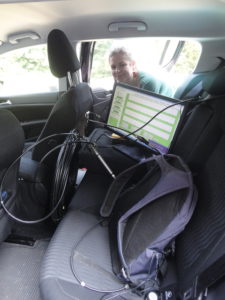
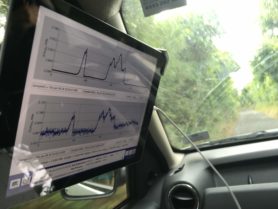
Things are all set in the first car, where I’m sitting. The two instruments are connected and working, we’ve placed the screens next to our sits. We took a lot of empty bags for sampling, as well as two small pumps. We’re also carrying tools and extra batteries / chargers in case. We are getting more organized than in the beginning, the installation is then faster! |
||||||||||||||||||||||||||||||||||||||||
Everything looks ready also in the second car, with Sara’s Picarro and air core. Today, we’re planning to visit sites that are a bit further. We want to drive to the county of Kent (east of England), until the Isle of Grain, where a major natural gas importation terminal is. |
||||||||||||||||||||||||||||||||||||||||
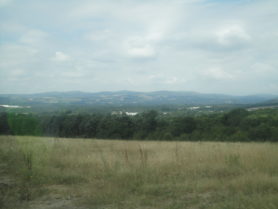
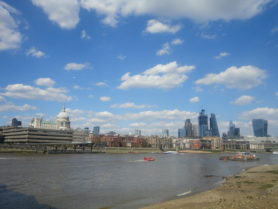
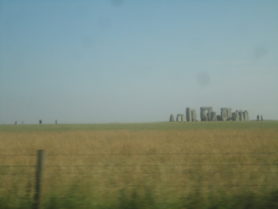
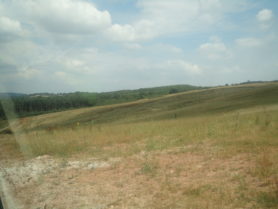
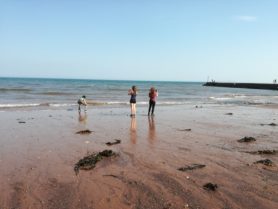
We could drive around the entire area. On the top, we can enjoy the view on the Devon hills.
During my free time
Friday night beer at Forester arms, Egham
|
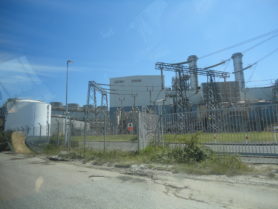


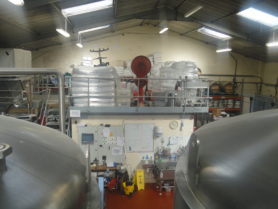
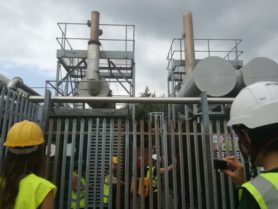
 On this last campaign, we’re having an appointment at a landfill. It was closed two years ago but it is still exploited as a biogas plant by the company Viridor. They plan to re-open the landfill in one year. It is located in Devon, which is about three hours drive from Egham. On the way, we could see
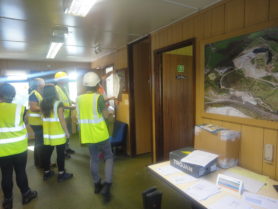
 Dave is trying some dilutions in order to produce the cylinders for calibrating the isotopic Picarro of other MEMO2 students using it. There will be four standards of different methane mixing ratios (roughly 2 and 10 ppm) and isotopic compositions. During my time at RHUL we searched for suitable sources to make the appropriate dilutions. The more 13C enriched standards will be dilutions of natural gas from the UK network, and the depleted source is an aliquot of biogas produced in a landfill we visited during the last campaign of our secondment. It happened that the methane content of Heathfield landfill biogas was not more than 20 %, but it will still be enough for the concentrations we’re aiming for in our dilutions. We’re diluting into a mix of pure N2 and O2 (respectively 80 and 20 %) from 2 cylinders, both tested before to check they did not contain significant amounts of methane.