Blogs
Barbara Szenasi – My research visit at Wageningen University
Blog written by Barbara Szenasi
My research project is about modelling atmospheric methane (CH4) across Europe and I work at the research institution LSCE in France. During my PhD, I am supposed to visit three different institutions in order to broaden my knowledge and closely work together with other PhD students within the European MEMO2 project.
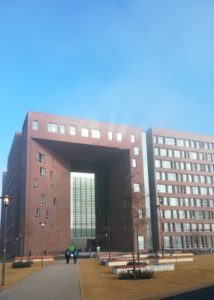
Forum building at the WUR campus
My first secondment was at the Wageningen University & Research (WUR) in the Netherlands. I was looking forward to do my secondment to meet new people in another environment and also because I had not been to Wageningen before. I was also excited about it for work reasons because I knew that I was going to learn to deal with a different kind of numerical model, a kind of one I had never had the opportunity to use. The numerical model I use at LSCE, CHIMERE, produces atmospheric mixing ratios (concentrations) of CH4. To do this, the model needs a CH4 emission input in form of emission inventories – you can think of them as a database containing information on methane emissions from individual sources. Although CH4 emissions are significant to the global warming impact in Europe, with CH4 gas being an important energy source of Europe, the emissions are not well quantified. If we have properly quantified sources of CH4, we can verify mitigation efforts and achieve effective emission reductions, as was agreed by the United Nations Climate Change Conference in Paris (COP21).
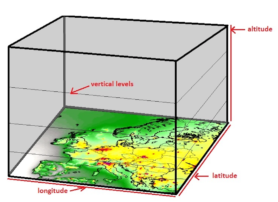
Structure of CHIMERE
One of the objectives of MEMO2 is to make a new CH4 emission map across Europe and to evaluate its accuracy. My part in this project is the evaluation and quantification of sources. To do so, we are going to use atmospheric measurements to calculate emission values. This is how we would like to obtain properly quantified sources. I have compared the modelled CH4 concentrations to surface measurements all across Europe. On one hand, this is necessary because we would like to know how well the CHIMERE model reproduces the concentrations in order to calculate the errors of the difference between the modelled and the measured concentrations. On the other hand, we would like to be able to determine the errors of the emission inventories we use as input. The results are essential for calculating emissions. CHIMERE has vertical levels for concentrations that reach from the surface level up to about 10.000 meters, which is equivalent to a pressure of about 300 hPa. So comparing measurements to model data at the surface level does not give us enough information, we need to make a comparison on the vertical levels too. For that, we use measurements of stations that measure CH4 at several heights and compare those measurements to the vertical levels of CHIMERE.
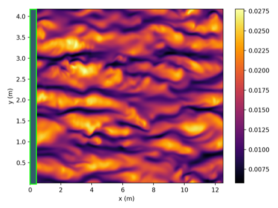
Example of near-surface wind speed in the vicinity of a line source of methane, as simulated with MicroHH. The velocities are normalized with the mean wind. The mean wind direction is towards the east (to the right).
However, this will not give us sufficient information, so we decided to additionally use another numerical model, which is great in performing calculations on vertical levels. This model is called MicroHH (for more info see www.microhh.org and https://www.geosci-model-dev.net/10/3145/2017/), developed by Chiel van Heerwaarden from Wageningen University in the Netherlands.To learn more about MicroHH, I went to Wageningen for a month-long secondment. The goal of my work at WUR was to be able to use MicroHH and run simulations with it and to produce some results in that one month. Luckily, there was an introductory lesson on MicroHH on my first Wednesday which I participated in. It was very useful and provided me an overview about what the model can do and helped to run a quick test simulation. There was an already prepared case which did not include CH4 but it was a helpful exercise for the later usage. MicroHH is a fluid dynamics model that is used for simulating turbulent flows in the atmosphere. Most of the flows we notice in daily life are turbulent, such as the flow around buildings or airplanes. The simulations with MicroHH are of high resolution, which gives a better representation of atmospheric processes. MicroHH is a small scale model which means that we do not use it for calculations across Europe for example, but rather across a field of e.g. 3×3 km. We aim to determine the representation error of how CH4 behaves in the vertical levels of the atmosphere. The representation error is the error of a model not perfectly representing the measured values. The representation error comes from the fact that the measurements and the modelled values are in different heights and locations, i.e. the measurement takes place at a point, whereas a model grid cell (a part of the model area) covers the location of the measurement and some additional km2. On top of that, the modelled value in a grid cell is an average value so that we compare point measurements with simulated data averaged over a grid cell of e.g. 100 km2. The other difficulty is that the model levels differ from the vertical levels of the measurements. It is important to know this error because a poor representation can result in high uncertainties in simulating concentrations. In MicroHH, one can place emissions in the simulation field and the horizontal distribution of the emissions can be changed as in any other model. Having different sets of emission distributions can help assessing the representation error in the vertical mixing of CH4. Changing the emission distribution will change the vertical profile and we can estimate the error following these changes.The first few days were a bit challenging as I could not execute MicroHH on my laptop. It took some time to sort it out but it gave me the opportunity to read more about MicroHH and gather the necessary data for a simulation run with CH4. Once that issue was solved, I could start preparing a simulation case for my task. We decided to make simulations at the location of two measurement stations. The requirement for choosing a measurement site was that it has to have measurements at different heights as we want to analyse the vertical behaviour of CH4.
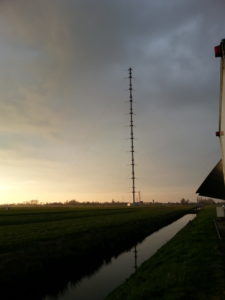
Measurement tower at Cabauw (see more here)
We choose a Dutch site called CESAR near the village of Cabauw, located in the mid-western part of the Netherlands, about 30 km from Utrecht, and a station called Trainou in more or less the centre region of France, which is about 15 km northeast from Orléans. Both sites have meteorological measurement towers equipped with lots of instruments at several sampling heights. Using the data from these measurement stations, I attempted to run simulations that did not quite work out at the beginning, which is often the case when you are learning something new and complex. The most difficult part for me was to implement CH4 in the correct way in the simulations. Anja and Chiel were there for me when I needed help but I generally like to try without help at first. CH4 was not the only variable I looked at when analysing the results, for example among others I evaluated wind and temperature data. You can see an example for the vertical profile of wind speed at the Cabauw tower on 23 June 2015 at 12 p.m. UTC in the figure below.
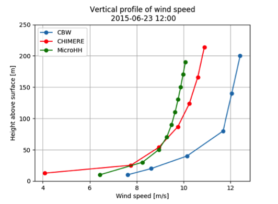
Vertical profile of wind speed at Cabauw measurement site on 23 June 2015 at 12 pm UTC compared to simulated wind speed using CHIMERE and MicroHH
It shows the measured values at Cabauw (CBW) and the simulation results of CHIMERE and MicroHH. The data is not interpolated at the same heights here. This is all I can show so far as this task has not been finished yet, but I am eager to have some interesting results soon.
The secondment at WUR gave me the opportunity to gain knowledge on how to use a fluid dynamics model and run different simulation cases with MicroHH. I have learned a lot and it definitely improved my modelling skills. Even though a month was not enough to obtain the results I hoped to have by the end of my secondment, I am confident that I can successfully continue this task at LSCE.
Working at WUR was a great opportunity to gain insight in another university and research institution and to get to know other researchers in my field. Additionally, it helped underpin the cooperation with the MEMO2 members working at WUR. Of course, staying in Wageningen was not all about work. I took the weekends and evenings to enjoy my time abroad and discover the Dutch culture a bit more. There were two things I liked the most: the after-work beers and Dutch pancakes! All in all, it was an exciting, challenging and somehow refreshing time for me.
Barbara Szenasi